| Red | Green | Blue | |
| z | 17.64 | ||
| znorm | Inf | ||
| sky | -NaN | -NaN | -Inf |
| S/N | 19.0 | 33.0 | 38.4 |
| S/N(c) | 0.0 | 0.0 | 0.0 |
| SN(E/C) |

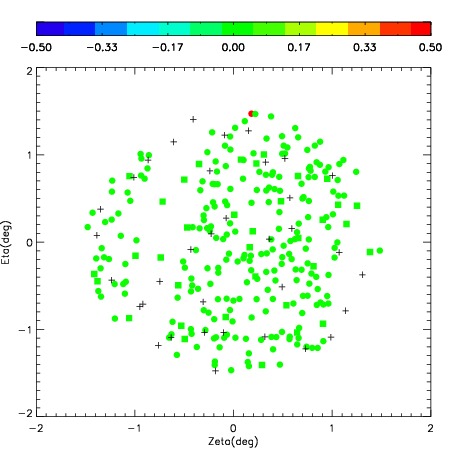

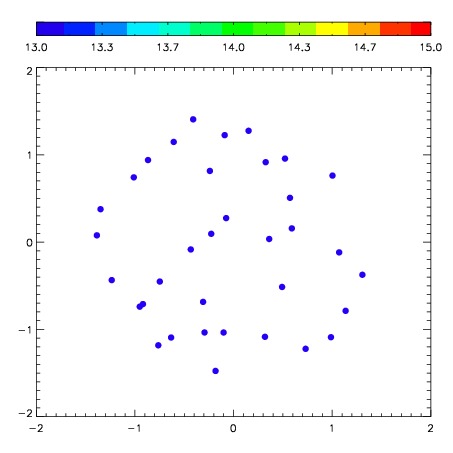

| Frame | Nreads | Zeropoints | Mag plots | Spatial mag deviation | Spatial sky 16325A emission deviations (filled: sky, open: star) | Spatial sky continuum emission | Spatial sky telluric CO2 absorption deviations (filled: H < 10) | |||||||||||||||||||||||
| 0 | 0 |
|
|
|
|
|
|
| IPAIR | NAME | SHIFT | NEWSHIFT | S/N | NAME | SHIFT | NEWSHIFT | S/N |
| 0 | 03780042 | 0.402374 | 0.00000 | 241.280 | 03780040 | 0.00177196 | 0.400602 | 206.015 |
| 1 | 03780037 | 0.388590 | 0.0137840 | 249.257 | 03780039 | 0.000558376 | 0.401816 | 233.237 |
| 2 | 03780038 | 0.392843 | 0.00953099 | 244.149 | 03780036 | 0.00000 | 0.402374 | 226.556 |
| 3 | 03780041 | 0.399540 | 0.00283399 | 219.302 | 03780043 | 0.00485218 | 0.397522 | 205.476 |