| Red | Green | Blue | |
| z | 17.64 | ||
| znorm | Inf | ||
| sky | -Inf | -Inf | -Inf |
| S/N | 18.6 | 31.6 | 37.0 |
| S/N(c) | 0.0 | 0.0 | 0.0 |
| SN(E/C) |

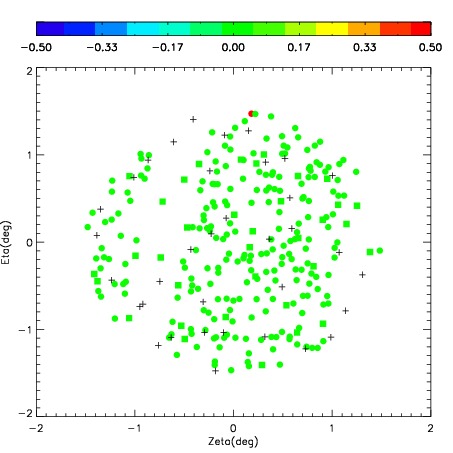
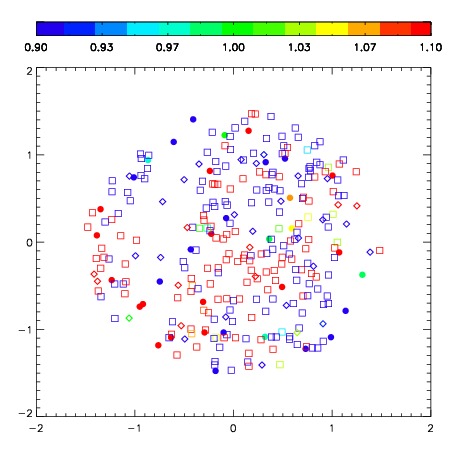
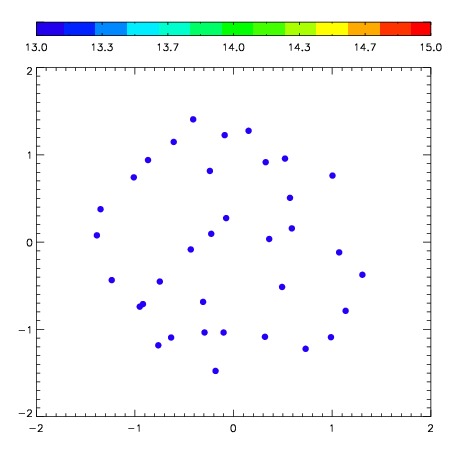
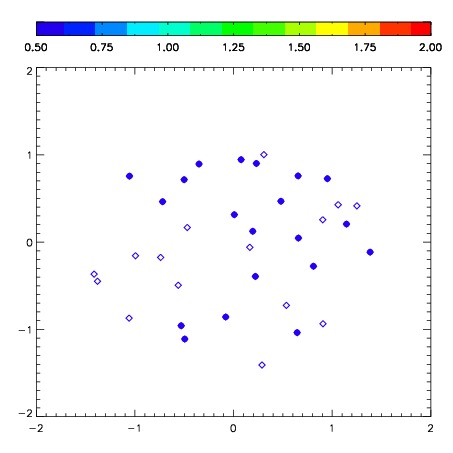
| Frame | Nreads | Zeropoints | Mag plots | Spatial mag deviation | Spatial sky 16325A emission deviations (filled: sky, open: star) | Spatial sky continuum emission | Spatial sky telluric CO2 absorption deviations (filled: H < 10) | |||||||||||||||||||||||
| 0 | 0 |
|
|
|
|
|
|
| IPAIR | NAME | SHIFT | NEWSHIFT | S/N | NAME | SHIFT | NEWSHIFT | S/N |
| 0 | 04010050 | 0.366349 | 0.00000 | 197.378 | 04010049 | -0.0222367 | 0.388586 | 167.968 |
| 1 | 04010046 | 0.352164 | 0.0141850 | 249.244 | 04010052 | -0.0115513 | 0.377900 | 237.182 |
| 2 | 04010047 | 0.353660 | 0.0126890 | 223.857 | 04010045 | 0.00000 | 0.366349 | 226.584 |
| 3 | 04010051 | 0.353883 | 0.0124660 | 222.424 | 04010048 | -0.0193594 | 0.385708 | 189.815 |