| Red | Green | Blue | |
| z | 17.64 | ||
| znorm | Inf | ||
| sky | -Inf | -Inf | -Inf |
| S/N | 25.5 | 41.6 | 47.7 |
| S/N(c) | 0.0 | 0.0 | 0.0 |
| SN(E/C) |

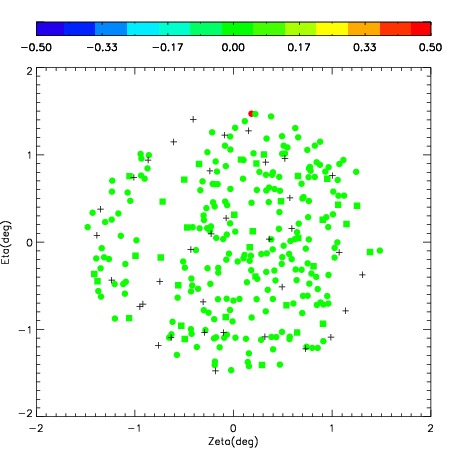

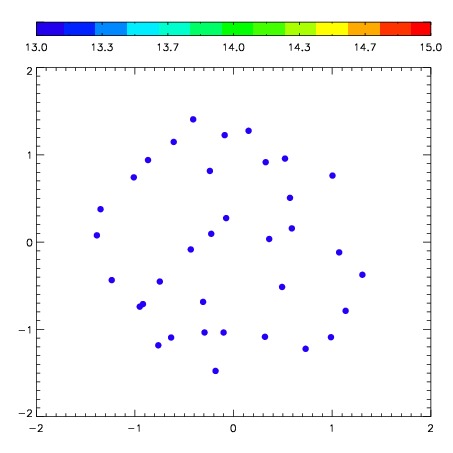
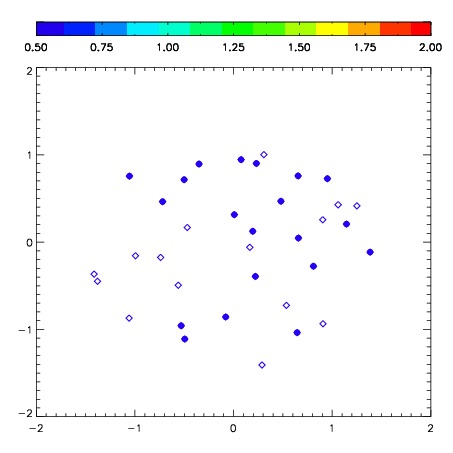
| Frame | Nreads | Zeropoints | Mag plots | Spatial mag deviation | Spatial sky 16325A emission deviations (filled: sky, open: star) | Spatial sky continuum emission | Spatial sky telluric CO2 absorption deviations (filled: H < 10) | |||||||||||||||||||||||
| 0 | 0 |
|
|
|
|
|
|
| IPAIR | NAME | SHIFT | NEWSHIFT | S/N | NAME | SHIFT | NEWSHIFT | S/N |
| 0 | 04040048 | 0.330270 | 0.00000 | 288.238 | 04040050 | 0.00317185 | 0.327098 | 280.375 |
| 1 | 04040049 | 0.325299 | 0.00497100 | 283.208 | 04040051 | 0.00232416 | 0.327946 | 280.013 |
| 2 | 04040052 | 0.330192 | 7.79927e-05 | 277.775 | 04040054 | 0.00160655 | 0.328663 | 274.086 |
| 3 | 04040053 | 0.327603 | 0.00266698 | 272.628 | 04040047 | 0.00000 | 0.330270 | 262.121 |