| Red | Green | Blue | |
| z | 17.64 | ||
| znorm | Inf | ||
| sky | -NaN | -Inf | -Inf |
| S/N | 23.2 | 38.0 | 41.5 |
| S/N(c) | 0.0 | 0.0 | 0.0 |
| SN(E/C) |

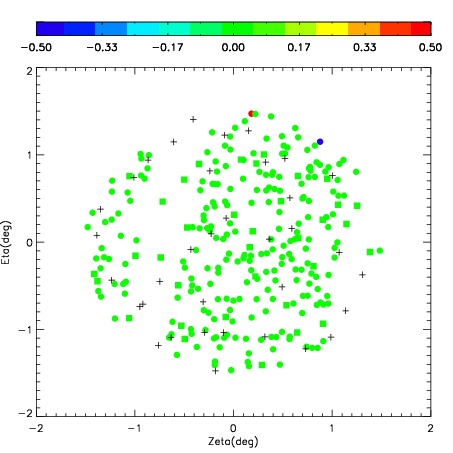
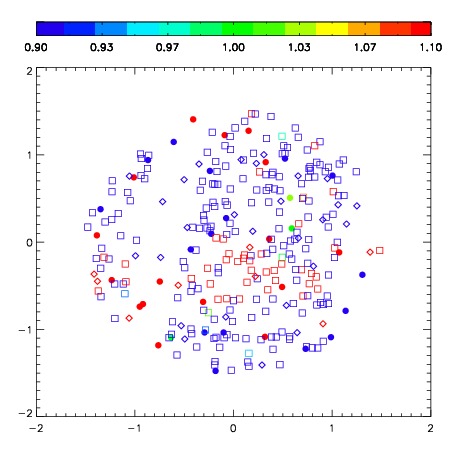
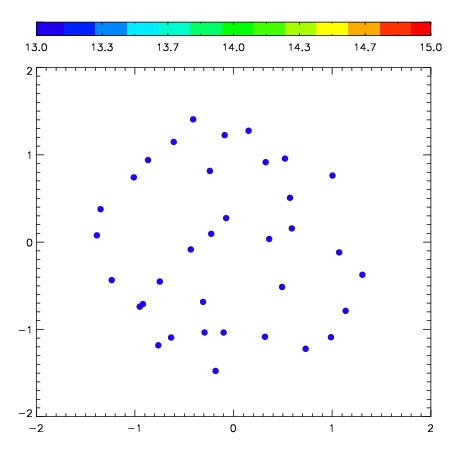
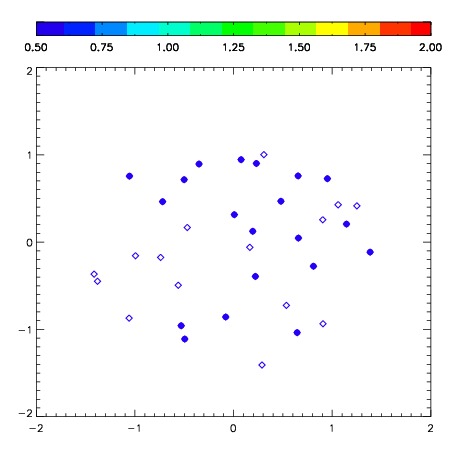
| Frame | Nreads | Zeropoints | Mag plots | Spatial mag deviation | Spatial sky 16325A emission deviations (filled: sky, open: star) | Spatial sky continuum emission | Spatial sky telluric CO2 absorption deviations (filled: H < 10) | |||||||||||||||||||||||
| 0 | 0 |
|
|
|
|
|
|
| IPAIR | NAME | SHIFT | NEWSHIFT | S/N | NAME | SHIFT | NEWSHIFT | S/N |
| 0 | 04060032 | 0.289482 | 0.00000 | 258.576 | 04060033 | -0.00643806 | 0.295920 | 262.319 |
| 1 | 04060028 | 0.273140 | 0.0163420 | 270.719 | 04060029 | -0.00839768 | 0.297880 | 270.051 |
| 2 | 04060027 | 0.276939 | 0.0125430 | 264.167 | 04060030 | -0.00770560 | 0.297188 | 265.063 |
| 3 | 04060031 | 0.285984 | 0.00349799 | 263.233 | 04060026 | 0.00000 | 0.289482 | 264.667 |