| Red | Green | Blue | |
| z | 17.64 | ||
| znorm | Inf | ||
| sky | -NaN | -NaN | -Inf |
| S/N | 27.3 | 46.1 | 50.2 |
| S/N(c) | 0.0 | 0.0 | 0.0 |
| SN(E/C) |

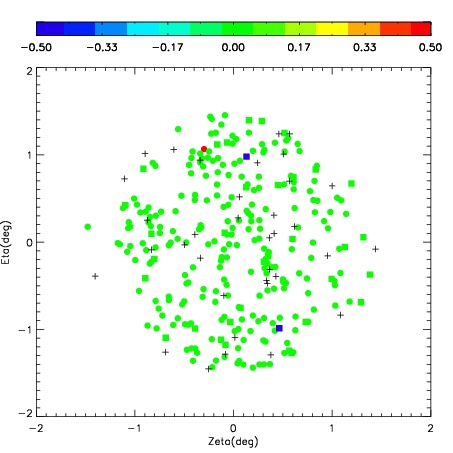

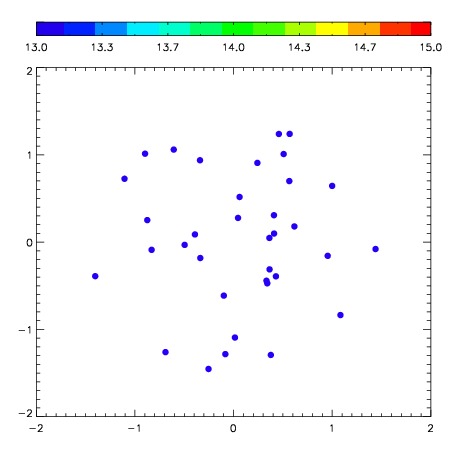
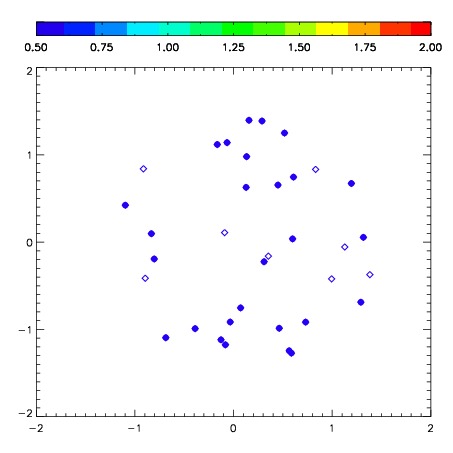
| Frame | Nreads | Zeropoints | Mag plots | Spatial mag deviation | Spatial sky 16325A emission deviations (filled: sky, open: star) | Spatial sky continuum emission | Spatial sky telluric CO2 absorption deviations (filled: H < 10) | |||||||||||||||||||||||
| 0 | 0 |
|
|
|
|
|
|
| IPAIR | NAME | SHIFT | NEWSHIFT | S/N | NAME | SHIFT | NEWSHIFT | S/N |
| 0 | 04280031 | 0.399988 | 0.00000 | 263.407 | 04280030 | 0.00000 | 0.399988 | 259.293 |
| 1 | 04280035 | 0.386166 | 0.0138220 | 273.231 | 04280037 | 0.0186776 | 0.381310 | 273.683 |
| 2 | 04280036 | 0.393942 | 0.00604600 | 269.937 | 04280034 | 0.0244044 | 0.375584 | 273.324 |
| 3 | 04280032 | 0.391030 | 0.00895798 | 266.150 | 04280033 | 0.0206454 | 0.379343 | 271.149 |