| Red | Green | Blue | |
| z | 17.64 | ||
| znorm | Inf | ||
| sky | -Inf | -NaN | -Inf |
| S/N | 22.9 | 38.7 | 42.1 |
| S/N(c) | 0.0 | 0.0 | 0.0 |
| SN(E/C) |

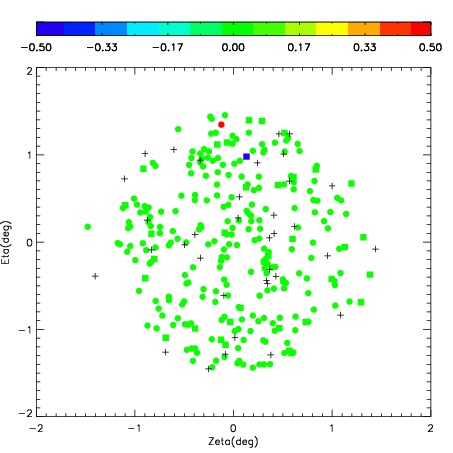
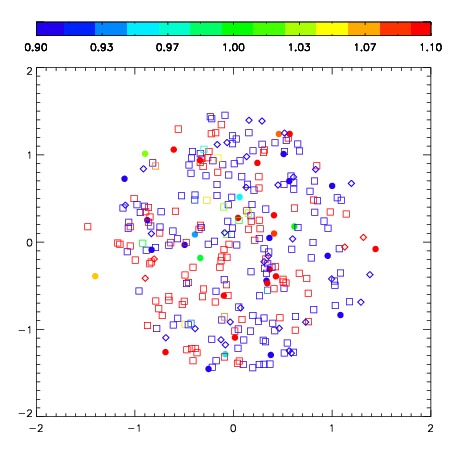
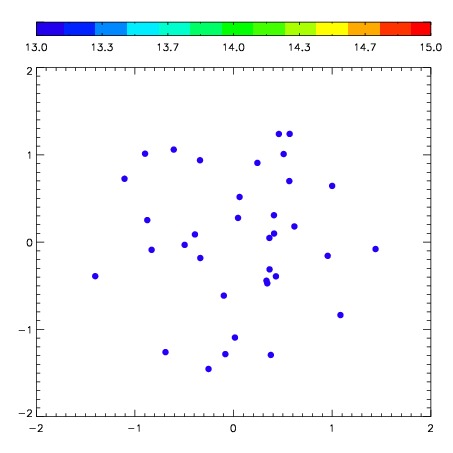
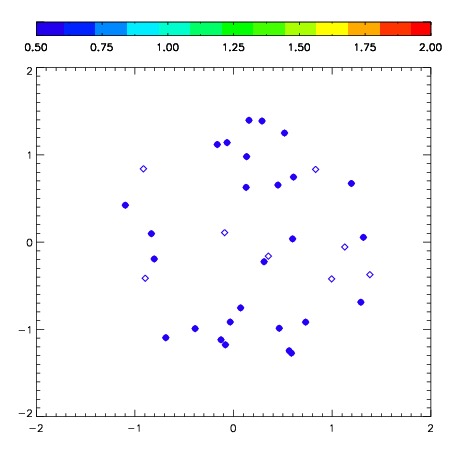
| Frame | Nreads | Zeropoints | Mag plots | Spatial mag deviation | Spatial sky 16325A emission deviations (filled: sky, open: star) | Spatial sky continuum emission | Spatial sky telluric CO2 absorption deviations (filled: H < 10) | |||||||||||||||||||||||
| 0 | 0 |
|
|
|
|
|
|
| IPAIR | NAME | SHIFT | NEWSHIFT | S/N | NAME | SHIFT | NEWSHIFT | S/N |
| 0 | 07830055 | 0.326372 | 0.00000 | 248.423 | 07830056 | -0.0314480 | 0.357820 | 234.779 |
| 1 | 07830054 | 0.323305 | 0.00306699 | 254.688 | 07830052 | -0.0276585 | 0.354030 | 253.907 |
| 2 | 07830051 | 0.322886 | 0.00348601 | 250.293 | 07830053 | -0.0316943 | 0.358066 | 253.246 |
| 3 | 07830050 | 0.325869 | 0.000503004 | 233.913 | 07830049 | 0.00000 | 0.326372 | 227.762 |