| Red | Green | Blue | |
| z | 17.64 | ||
| znorm | Inf | ||
| sky | -NaN | -NaN | -Inf |
| S/N | 30.5 | 54.0 | 61.1 |
| S/N(c) | 0.0 | 0.0 | 0.0 |
| SN(E/C) |

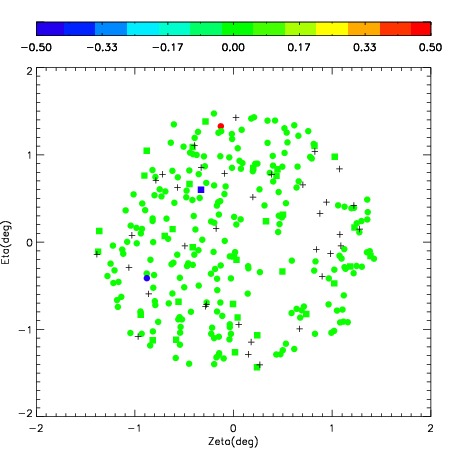
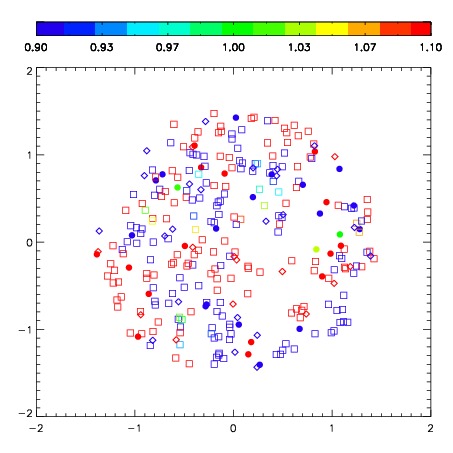


| Frame | Nreads | Zeropoints | Mag plots | Spatial mag deviation | Spatial sky 16325A emission deviations (filled: sky, open: star) | Spatial sky continuum emission | Spatial sky telluric CO2 absorption deviations (filled: H < 10) | |||||||||||||||||||||||
| 0 | 0 |
|
|
|
|
|
|
| IPAIR | NAME | SHIFT | NEWSHIFT | S/N | NAME | SHIFT | NEWSHIFT | S/N |
| 0 | 03750087 | 0.436395 | 0.00000 | 282.829 | 03750088 | -0.0198537 | 0.456249 | 288.166 |
| 1 | 03750086 | 0.428182 | 0.00821298 | 276.414 | 03750085 | -0.0169272 | 0.453322 | 280.714 |
| 2 | 03750083 | 0.435787 | 0.000607997 | 270.456 | 03750084 | -0.0185544 | 0.454949 | 276.688 |
| 3 | 03750082 | 0.428393 | 0.00800198 | 264.306 | 03750081 | -0.0166283 | 0.453023 | 260.752 |
| 4 | 03750079 | 0.430933 | 0.00546199 | 249.355 | 03750080 | -0.0186428 | 0.455038 | 252.151 |
| 5 | 03750078 | 0.427976 | 0.00841898 | 238.892 | 03750077 | 0.00000 | 0.436395 | 235.270 |