| Red | Green | Blue | |
| z | 17.64 | ||
| znorm | Inf | ||
| sky | -NaN | -NaN | -Inf |
| S/N | 25.4 | 42.1 | 49.9 |
| S/N(c) | 0.0 | 0.0 | 0.0 |
| SN(E/C) |


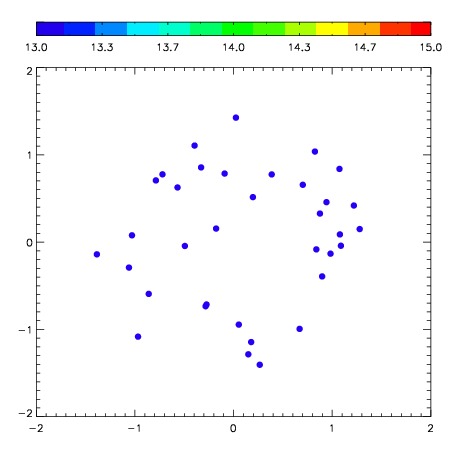
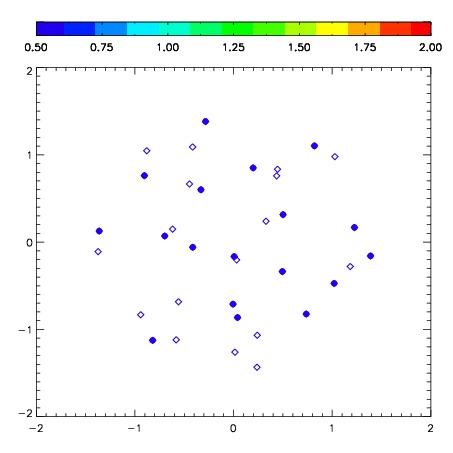
| Frame | Nreads | Zeropoints | Mag plots | Spatial mag deviation | Spatial sky 16325A emission deviations (filled: sky, open: star) | Spatial sky continuum emission | Spatial sky telluric CO2 absorption deviations (filled: H < 10) | |||||||||||||||||||||||
| 0 | 0 |
|
|
|
|
|
|
| IPAIR | NAME | SHIFT | NEWSHIFT | S/N | NAME | SHIFT | NEWSHIFT | S/N |
| 0 | 04290040 | 0.372852 | 0.00000 | 251.546 | 04290037 | -0.0573845 | 0.430236 | 245.205 |
| 1 | 04290039 | 0.368137 | 0.00471500 | 252.136 | 04290041 | -0.0546689 | 0.427521 | 256.365 |
| 2 | 04290035 | 0.370417 | 0.00243500 | 238.052 | 04290038 | -0.0424023 | 0.415254 | 242.387 |
| 3 | 04290036 | 0.370107 | 0.00274500 | 237.967 | 04290034 | 0.00000 | 0.372852 | 237.361 |