| Red | Green | Blue | |
| z | 17.64 | ||
| znorm | Inf | ||
| sky | -NaN | -Inf | -Inf |
| S/N | 27.5 | 46.5 | 51.2 |
| S/N(c) | 0.0 | 0.0 | 0.0 |
| SN(E/C) |

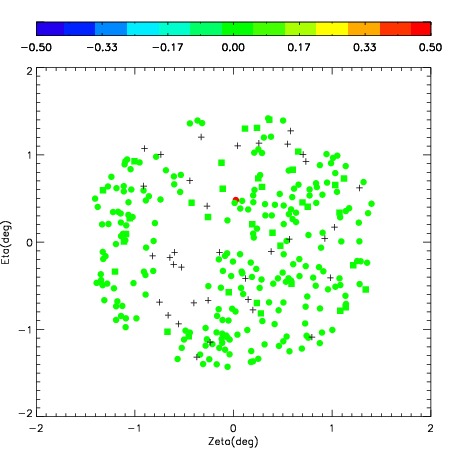

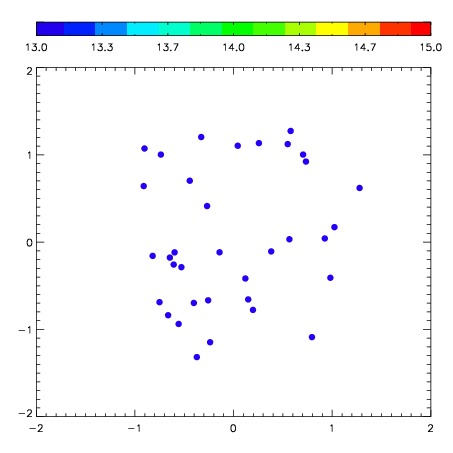

| Frame | Nreads | Zeropoints | Mag plots | Spatial mag deviation | Spatial sky 16325A emission deviations (filled: sky, open: star) | Spatial sky continuum emission | Spatial sky telluric CO2 absorption deviations (filled: H < 10) | |||||||||||||||||||||||
| 0 | 0 |
|
|
|
|
|
|
| IPAIR | NAME | SHIFT | NEWSHIFT | S/N | NAME | SHIFT | NEWSHIFT | S/N |
| 0 | 04560026 | 0.413466 | 0.00000 | 222.715 | 04560025 | 0.00000 | 0.413466 | 205.579 |
| 1 | 04560031 | 0.386682 | 0.0267840 | 247.395 | 04560032 | -0.00254476 | 0.416011 | 254.591 |
| 2 | 04560030 | 0.375924 | 0.0375420 | 244.834 | 04560029 | -0.00346306 | 0.416929 | 240.030 |
| 3 | 04560027 | 0.409678 | 0.00378799 | 232.027 | 04560028 | -0.00390567 | 0.417372 | 231.335 |