| Red | Green | Blue | |
| z | 17.64 | ||
| znorm | Inf | ||
| sky | -Inf | -Inf | -Inf |
| S/N | 16.7 | 30.3 | 35.7 |
| S/N(c) | 0.0 | 0.0 | 0.0 |
| SN(E/C) |

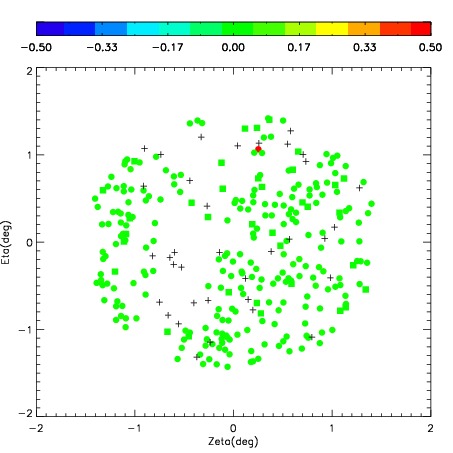
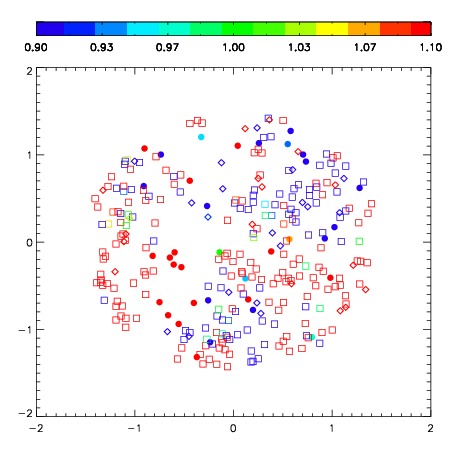

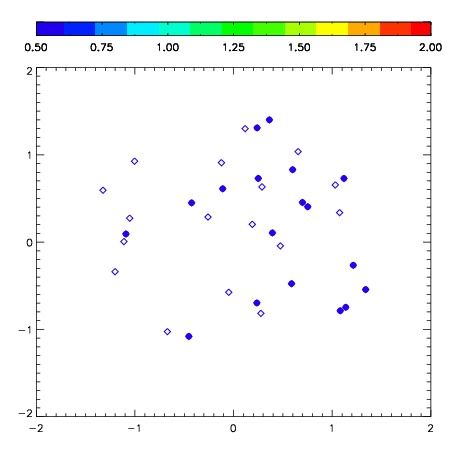
| Frame | Nreads | Zeropoints | Mag plots | Spatial mag deviation | Spatial sky 16325A emission deviations (filled: sky, open: star) | Spatial sky continuum emission | Spatial sky telluric CO2 absorption deviations (filled: H < 10) | |||||||||||||||||||||||
| 0 | 0 |
|
|
|
|
|
|
| IPAIR | NAME | SHIFT | NEWSHIFT | S/N | NAME | SHIFT | NEWSHIFT | S/N |
| 0 | 07040064 | 0.473186 | 0.00000 | 200.704 | 07040063 | 0.0488052 | 0.424381 | 184.915 |
| 1 | 07040060 | 0.461066 | 0.0121200 | 223.485 | 07040067 | 0.0465277 | 0.426658 | 229.432 |
| 2 | 07040068 | 0.460818 | 0.0123680 | 223.383 | 07040059 | 0.00000 | 0.473186 | 208.143 |
| 3 | 07040061 | 0.469495 | 0.00369099 | 209.145 | 07040066 | 0.0455090 | 0.427677 | 200.921 |
| 4 | 07040065 | 0.470119 | 0.00306699 | 199.992 | 07040062 | 0.0503569 | 0.422829 | 181.371 |