| Red | Green | Blue | |
| z | 17.64 | ||
| znorm | Inf | ||
| sky | -NaN | -NaN | -Inf |
| S/N | 19.8 | 34.8 | 38.4 |
| S/N(c) | 0.0 | 0.0 | 0.0 |
| SN(E/C) |

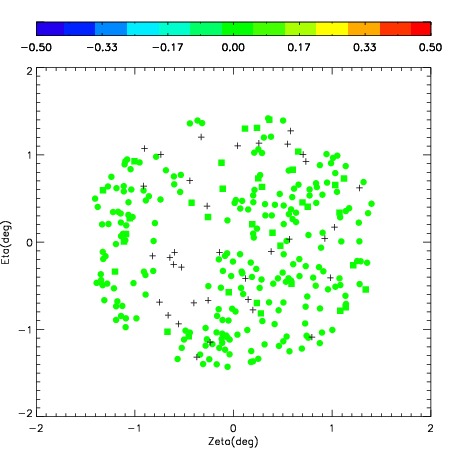


| Frame | Nreads | Zeropoints | Mag plots | Spatial mag deviation | Spatial sky 16325A emission deviations (filled: sky, open: star) | Spatial sky continuum emission | Spatial sky telluric CO2 absorption deviations (filled: H < 10) | |||||||||||||||||||||||
| 0 | 0 |
|
|
|
|
|
|
| IPAIR | NAME | SHIFT | NEWSHIFT | S/N | NAME | SHIFT | NEWSHIFT | S/N |
| 0 | 07850049 | 0.354901 | 0.00000 | 204.684 | 07850048 | 0.00000 | 0.354901 | 195.878 |
| 1 | 07850054 | 0.337246 | 0.0176550 | 227.190 | 07850055 | -0.00385249 | 0.358753 | 220.765 |
| 2 | 07850053 | 0.343287 | 0.0116140 | 224.494 | 07850051 | -0.00273952 | 0.357641 | 220.519 |
| 3 | 07850050 | 0.349051 | 0.00584999 | 212.990 | 07850052 | -0.00806473 | 0.362966 | 212.906 |