| Red | Green | Blue | |
| z | 17.64 | ||
| znorm | Inf | ||
| sky | -Inf | -NaN | -Inf |
| S/N | 25.6 | 45.6 | 51.2 |
| S/N(c) | 0.0 | 0.0 | 0.0 |
| SN(E/C) |

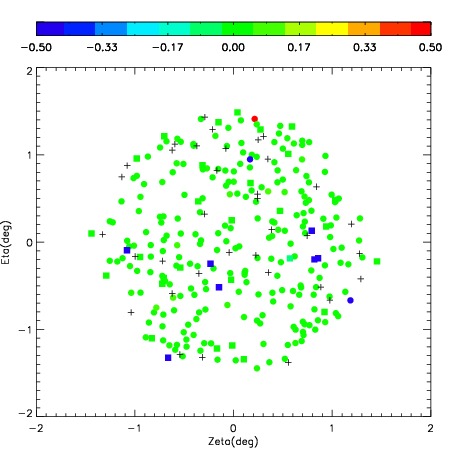
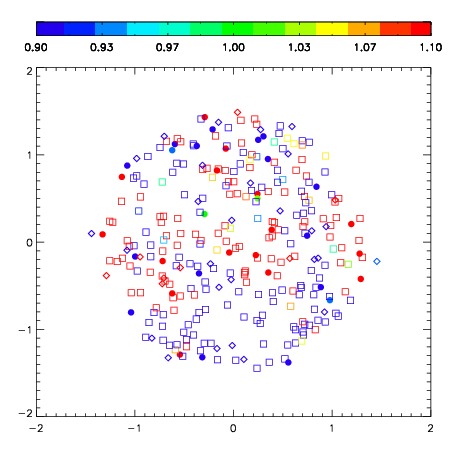

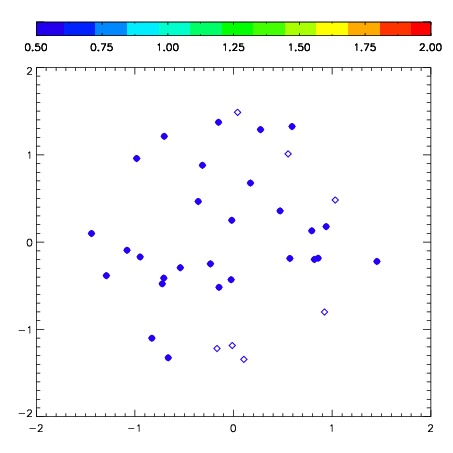
| Frame | Nreads | Zeropoints | Mag plots | Spatial mag deviation | Spatial sky 16325A emission deviations (filled: sky, open: star) | Spatial sky continuum emission | Spatial sky telluric CO2 absorption deviations (filled: H < 10) | |||||||||||||||||||||||
| 0 | 0 |
|
|
|
|
|
|
| IPAIR | NAME | SHIFT | NEWSHIFT | S/N | NAME | SHIFT | NEWSHIFT | S/N |
| 0 | 03770053 | 0.466579 | 0.00000 | 244.683 | 03770054 | 0.0112315 | 0.455347 | 233.283 |
| 1 | 03770048 | 0.455418 | 0.0111610 | 261.956 | 03770047 | 0.00000 | 0.466579 | 260.469 |
| 2 | 03770052 | 0.456280 | 0.0102990 | 255.870 | 03770050 | 0.00964460 | 0.456934 | 258.222 |
| 3 | 03770049 | 0.455103 | 0.0114760 | 251.393 | 03770051 | 0.00976914 | 0.456810 | 245.060 |