| Red | Green | Blue | |
| z | 17.63 | ||
| znorm | Inf | ||
| sky | -NaN | -NaN | -Inf |
| S/N | 24.0 | 42.0 | 48.0 |
| S/N(c) | 0.0 | 0.0 | 0.0 |
| SN(E/C) |

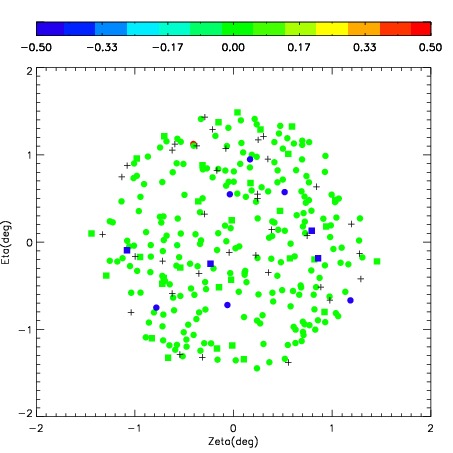
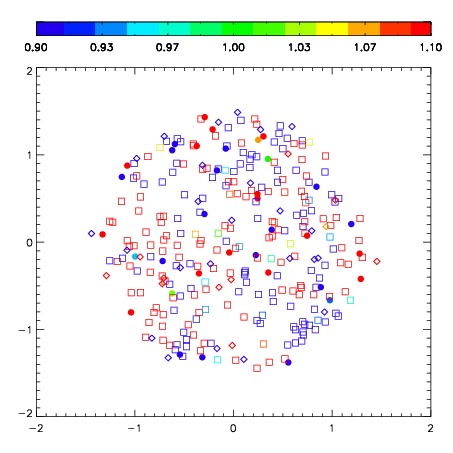


| Frame | Nreads | Zeropoints | Mag plots | Spatial mag deviation | Spatial sky 16325A emission deviations (filled: sky, open: star) | Spatial sky continuum emission | Spatial sky telluric CO2 absorption deviations (filled: H < 10) | |||||||||||||||||||||||
| 0 | 0 |
|
|
|
|
|
|
| IPAIR | NAME | SHIFT | NEWSHIFT | S/N | NAME | SHIFT | NEWSHIFT | S/N |
| 0 | 04290046 | 0.459058 | 0.00000 | 234.473 | 04290045 | 0.00000 | 0.459058 | 240.746 |
| 1 | 04290050 | 0.444817 | 0.0142410 | 250.293 | 04290049 | 0.00111324 | 0.457945 | 250.330 |
| 2 | 04290047 | 0.457598 | 0.00145999 | 245.829 | 04290048 | 0.00192584 | 0.457132 | 249.717 |
| 3 | 04290051 | 0.449876 | 0.00918198 | 244.735 | 04290052 | 0.00143322 | 0.457625 | 248.954 |