| Red | Green | Blue | |
| z | 17.63 | ||
| znorm | Inf | ||
| sky | -NaN | -NaN | -Inf |
| S/N | 29.6 | 48.9 | 54.7 |
| S/N(c) | 0.0 | 0.0 | 0.0 |
| SN(E/C) |

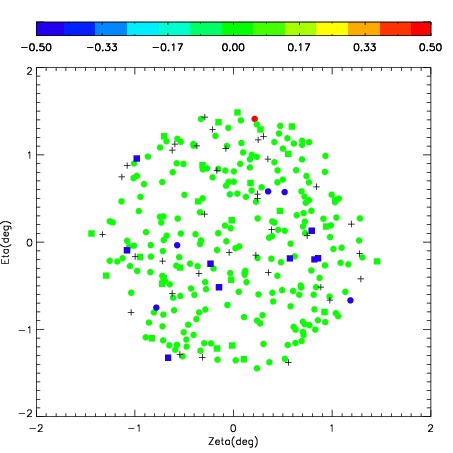


| Frame | Nreads | Zeropoints | Mag plots | Spatial mag deviation | Spatial sky 16325A emission deviations (filled: sky, open: star) | Spatial sky continuum emission | Spatial sky telluric CO2 absorption deviations (filled: H < 10) | |||||||||||||||||||||||
| 0 | 0 |
|
|
|
|
|
|
| IPAIR | NAME | SHIFT | NEWSHIFT | S/N | NAME | SHIFT | NEWSHIFT | S/N |
| 0 | 04370012 | 0.451833 | 0.00000 | 277.288 | 04370014 | 0.0334313 | 0.418402 | 277.968 |
| 1 | 04370016 | 0.442427 | 0.00940600 | 276.726 | 04370017 | 0.0356558 | 0.416177 | 277.661 |
| 2 | 04370011 | 0.446060 | 0.00577301 | 276.230 | 04370010 | 0.00000 | 0.451833 | 277.396 |
| 3 | 04370015 | 0.435501 | 0.0163320 | 275.932 | 04370013 | 0.0400594 | 0.411774 | 276.824 |