| Frame | Nreads | Zeropoints | Mag plots
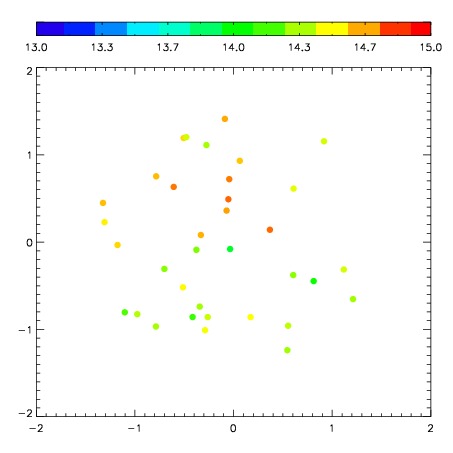
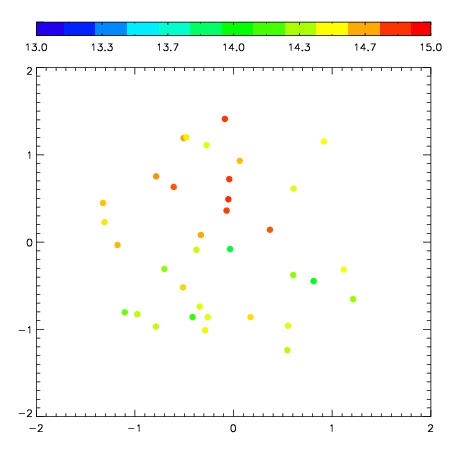
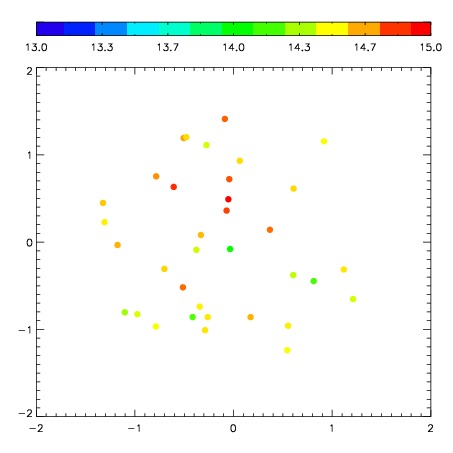
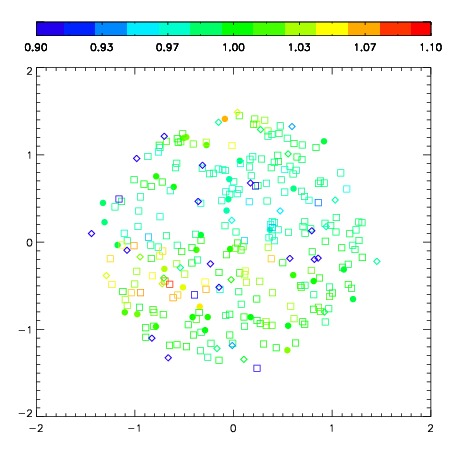
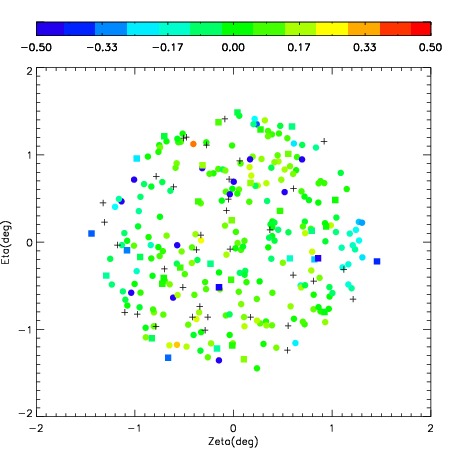
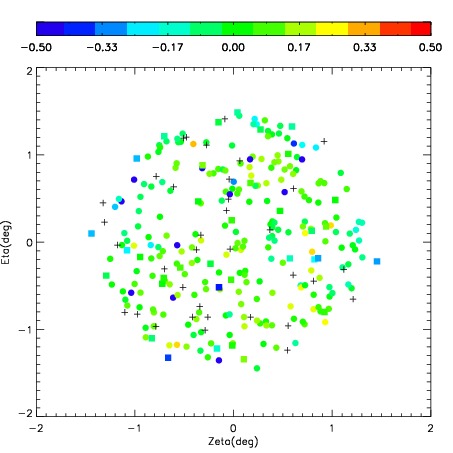
| Spatial mag deviation
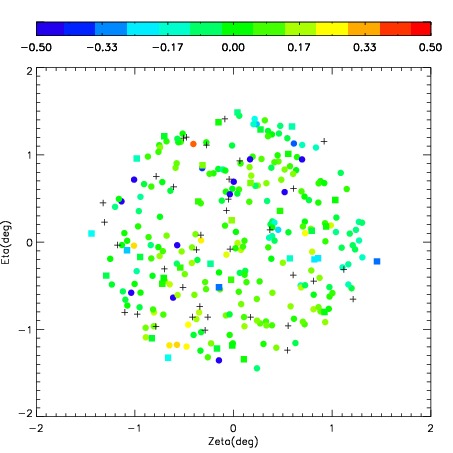
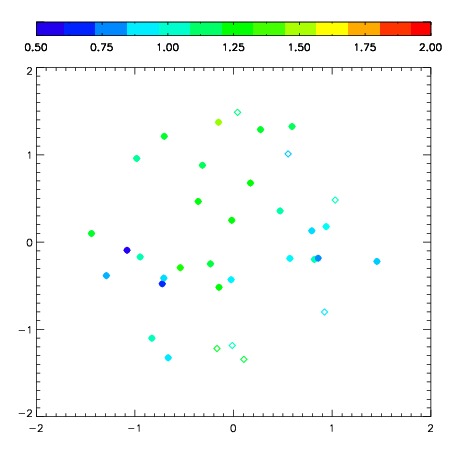
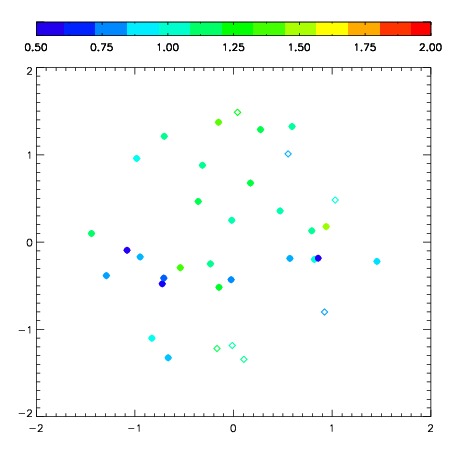
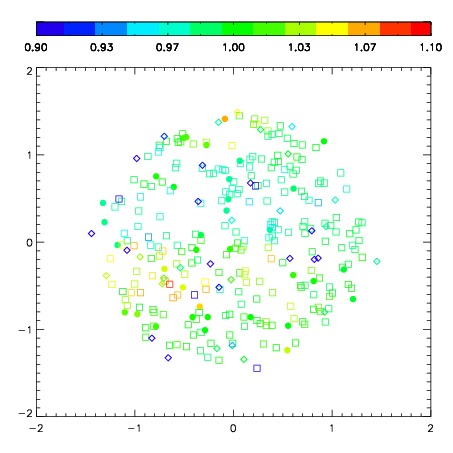
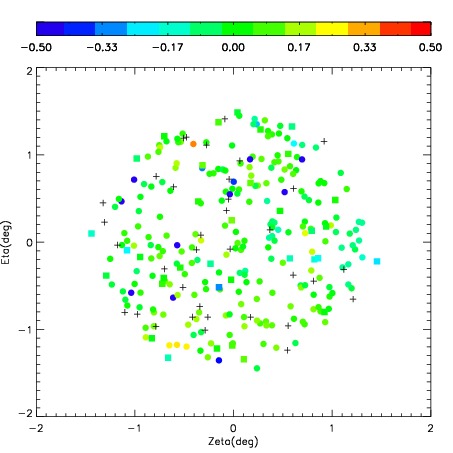
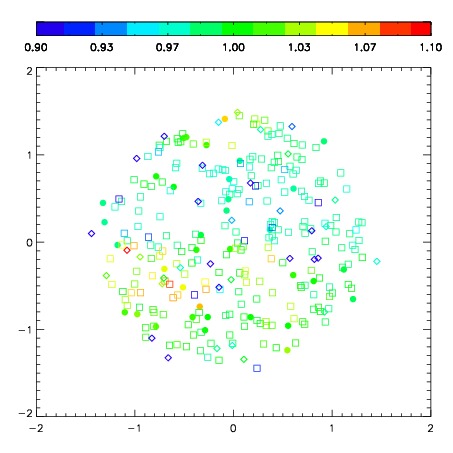
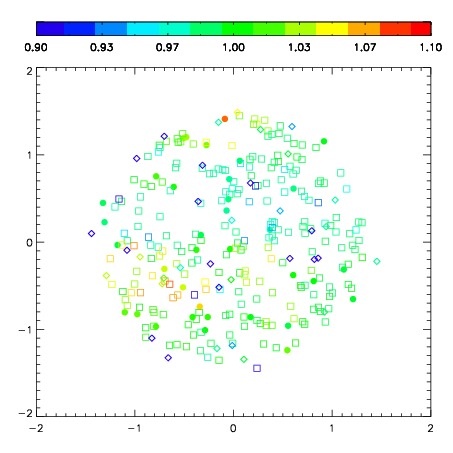
| Spatial sky 16325A emission deviations (filled: sky, open: star)
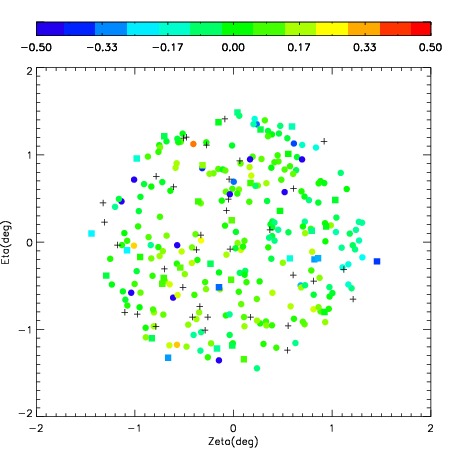
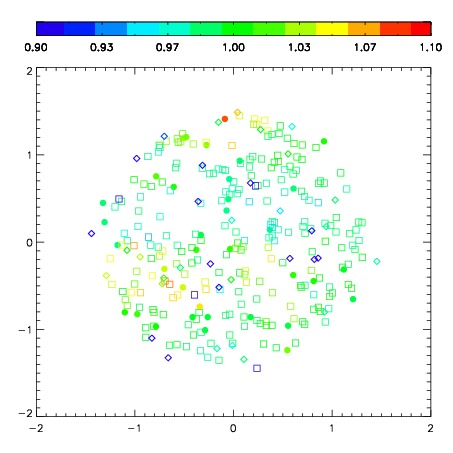
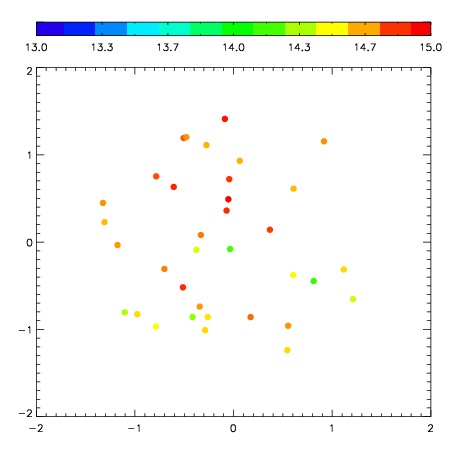
| Spatial sky continuum emission
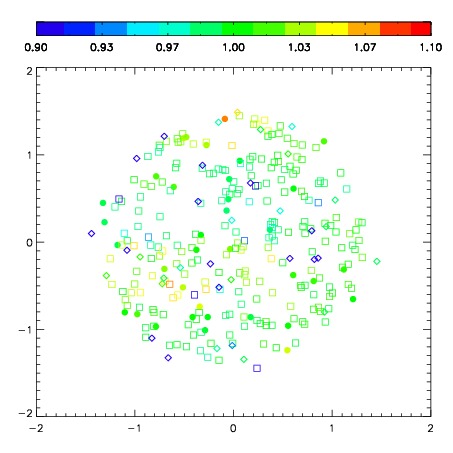
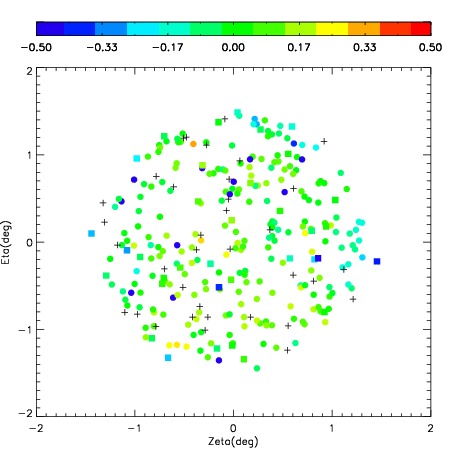
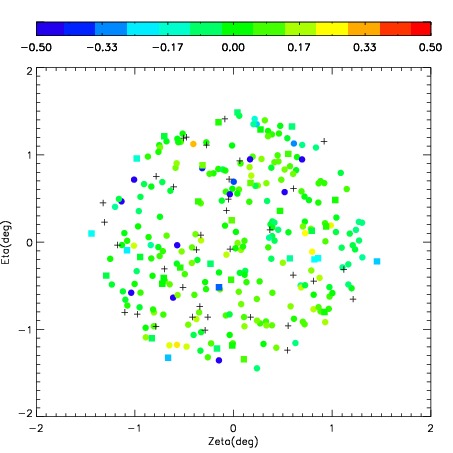
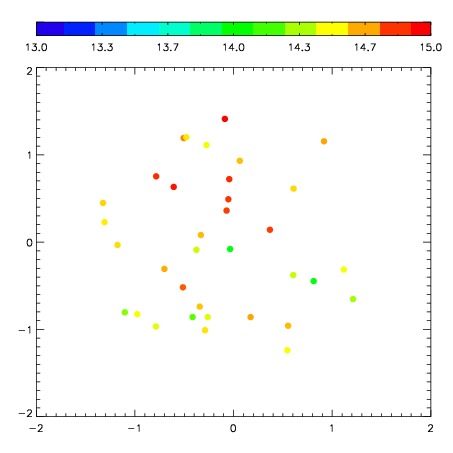
| Spatial sky telluric CO2 absorption deviations (filled: H < 10)
|
| 3780047
| 47
| | Red | Green | Blue
| | z | | 18.22
| | znorm | | 14.04
| | sky | 14.7 | 14.4 | 14.4
| | S/N | 8.2 | 14.3 | 16.2
| | S/N(c) | 6.9 | 13.4 | 14.9
| | SN(E/C) 0.38
|
| 
| 
| 
| 
| 
|
| 3780048
| 47
| | Red | Green | Blue
| | z | | 18.52
| | znorm | | 14.34
| | sky | 14.9 | 14.4 | 14.5
| | S/N | 10.1 | 17.2 | 19.4
| | S/N(c) | 8.8 | 15.9 | 18.3
| | SN(E/C) 0.26
|
| 
| 
| 
| 
| 
|
| 3780049
| 47
| | Red | Green | Blue
| | z | | 18.35
| | znorm | | 14.17
| | sky | 14.7 | 14.5 | 14.6
| | S/N | 9.1 | 15.7 | 17.7
| | S/N(c) | 7.8 | 14.3 | 15.9
| | SN(E/C) 0.32
|
| 
| 
| 
| 
| 
|
| 3780050
| 47
| | Red | Green | Blue
| | z | | 17.94
| | znorm | | 13.76
| | sky | 14.9 | 14.5 | 14.7
| | S/N | 6.6 | 12.3 | 13.6
| | S/N(c) | 5.6 | 11.1 | 12.4
| | SN(E/C) 0.41
|
| 
| 
| 
| 
| 
|
| 3780051
| 47
| | Red | Green | Blue
| | z | | 18.08
| | znorm | | 13.90
| | sky | 14.8 | 14.5 | 14.6
| | S/N | 7.4 | 13.6 | 15.1
| | S/N(c) | 6.3 | 12.4 | 14.0
| | SN(E/C) 0.35
|
| 
| 
| 
| 
| 
|
| 3780052
| 47
| | Red | Green | Blue
| | z | | 17.86
| | znorm | | 13.68
| | sky | 15.1 | 14.7 | 14.8
| | S/N | 6.3 | 11.8 | 12.9
| | S/N(c) | 5.3 | 10.6 | 12.0
| | SN(E/C) 0.42
|
| 
| 
| 
| 
| 
|
| 3780053
| 47
| | Red | Green | Blue
| | z | | 18.57
| | znorm | | 14.39
| | sky | 14.8 | 14.5 | 14.6
| | S/N | 10.6 | 18.3 | 19.9
| | S/N(c) | 9.0 | 16.6 | 18.4
| | SN(E/C) 0.29
|
| 
| 
| 
| 
| 
|
| 3780054
| 47
| | Red | Green | Blue
| | z | | 18.35
| | znorm | | 14.17
| | sky | 14.9 | 14.6 | 14.6
| | S/N | 9.0 | 15.9 | 17.2
| | S/N(c) | 7.7 | 14.1 | 16.1
| | SN(E/C) 0.34
|
| 
| 
| 
| 
| 
|