| Red | Green | Blue | |
| z | 17.64 | ||
| znorm | Inf | ||
| sky | -Inf | -Inf | -Inf |
| S/N | 14.2 | 27.0 | 30.8 |
| S/N(c) | 0.0 | 0.0 | 0.0 |
| SN(E/C) |

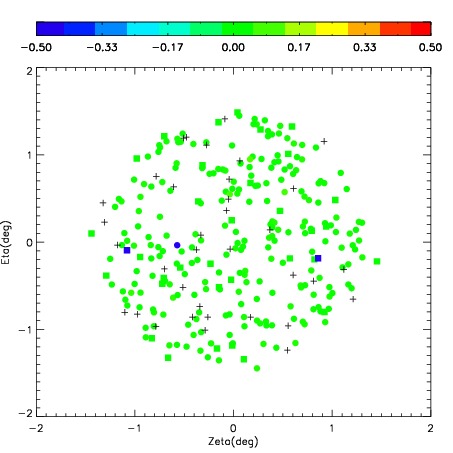
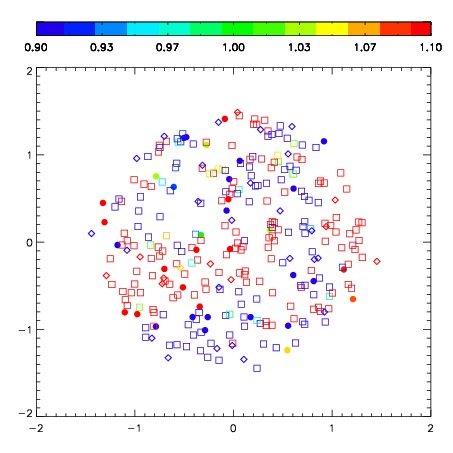

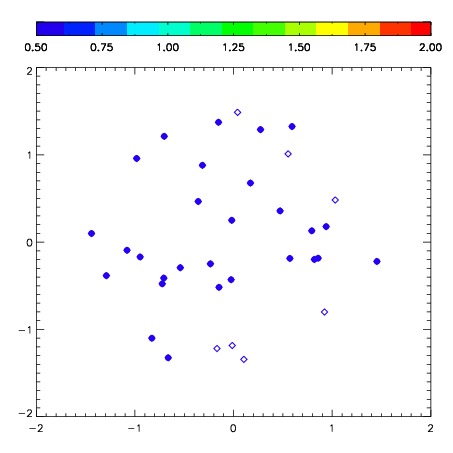
| Frame | Nreads | Zeropoints | Mag plots | Spatial mag deviation | Spatial sky 16325A emission deviations (filled: sky, open: star) | Spatial sky continuum emission | Spatial sky telluric CO2 absorption deviations (filled: H < 10) | |||||||||||||||||||||||
| 0 | 0 |
|
|
|
|
|
|
| IPAIR | NAME | SHIFT | NEWSHIFT | S/N | NAME | SHIFT | NEWSHIFT | S/N |
| 0 | 03780048 | 0.457915 | 0.00000 | 214.887 | 03780047 | 0.00000 | 0.457915 | 186.134 |
| 1 | 03780053 | 0.451349 | 0.00656602 | 221.212 | 03780054 | -0.000538856 | 0.458454 | 194.383 |
| 2 | 03780049 | 0.457053 | 0.000862002 | 192.177 | 03780051 | -0.00280476 | 0.460720 | 172.966 |
| 3 | 03780052 | 0.455364 | 0.00255102 | 156.012 | 03780050 | 0.00577000 | 0.452145 | 161.798 |