| Red | Green | Blue | |
| z | 17.64 | ||
| znorm | Inf | ||
| sky | -Inf | -Inf | -Inf |
| S/N | 19.8 | 34.7 | 38.6 |
| S/N(c) | 0.0 | 0.0 | 0.0 |
| SN(E/C) |
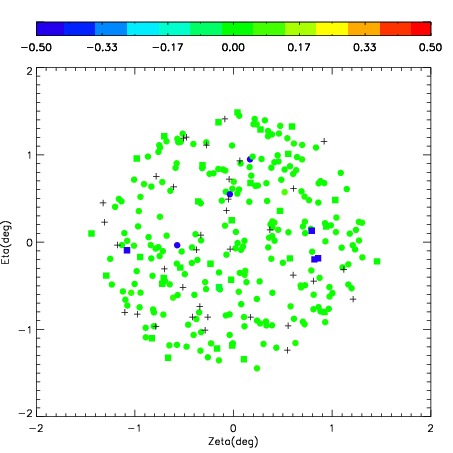
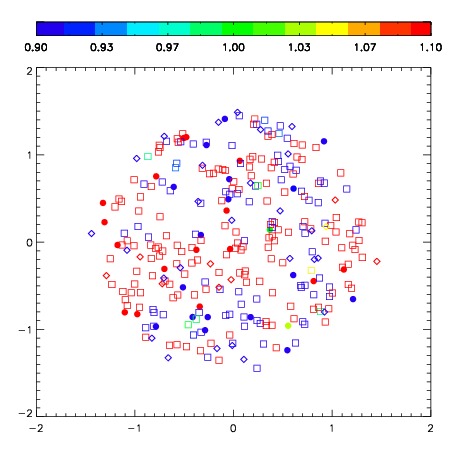


| Frame | Nreads | Zeropoints | Mag plots | Spatial mag deviation | Spatial sky 16325A emission deviations (filled: sky, open: star) | Spatial sky continuum emission | Spatial sky telluric CO2 absorption deviations (filled: H < 10) | |||||||||||||||||||||||
| 0 | 0 |
|
|
|
|
|
|
| IPAIR | NAME | SHIFT | NEWSHIFT | S/N | NAME | SHIFT | NEWSHIFT | S/N |
| 0 | 04360012 | 0.454250 | 0.00000 | 215.966 | 04360014 | 0.00815636 | 0.446094 | 212.264 |
| 1 | 04360016 | 0.448359 | 0.00589100 | 242.840 | 04360013 | 0.0115381 | 0.442712 | 224.309 |
| 2 | 04360015 | 0.446537 | 0.00771302 | 239.533 | 04360017 | 0.0110381 | 0.443212 | 224.022 |
| 3 | 04360011 | 0.452768 | 0.00148201 | 215.050 | 04360010 | 0.00000 | 0.454250 | 205.120 |