| Red | Green | Blue | |
| z | 17.64 | ||
| znorm | Inf | ||
| sky | -NaN | -NaN | -Inf |
| S/N | 19.7 | 36.3 | 39.5 |
| S/N(c) | 0.0 | 0.0 | 0.0 |
| SN(E/C) |

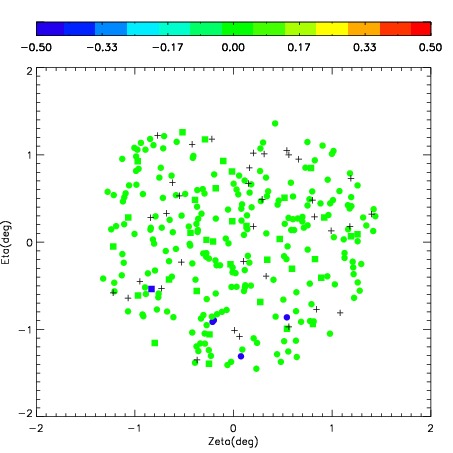


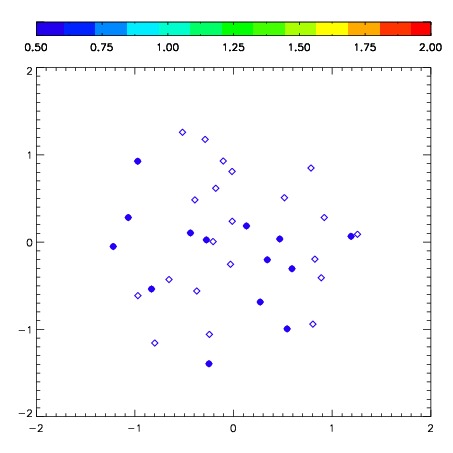
| Frame | Nreads | Zeropoints | Mag plots | Spatial mag deviation | Spatial sky 16325A emission deviations (filled: sky, open: star) | Spatial sky continuum emission | Spatial sky telluric CO2 absorption deviations (filled: H < 10) | |||||||||||||||||||||||
| 0 | 0 |
|
|
|
|
|
|
| IPAIR | NAME | SHIFT | NEWSHIFT | S/N | NAME | SHIFT | NEWSHIFT | S/N |
| 0 | 03740046 | 0.447869 | 0.00000 | 210.362 | 03740045 | 0.00000 | 0.447869 | 202.206 |
| 1 | 03740050 | 0.442126 | 0.00574300 | 226.606 | 03740049 | -0.0159920 | 0.463861 | 225.304 |
| 2 | 03740047 | 0.443276 | 0.00459301 | 211.188 | 03740048 | -0.0180795 | 0.465948 | 216.293 |
| 3 | 03740051 | 0.441614 | 0.00625500 | 207.500 | 03740052 | -0.0101530 | 0.458022 | 199.479 |