| Red | Green | Blue | |
| z | 17.64 | ||
| znorm | Inf | ||
| sky | -NaN | -NaN | -Inf |
| S/N | 25.0 | 43.5 | 49.6 |
| S/N(c) | 0.0 | 0.0 | 0.0 |
| SN(E/C) |


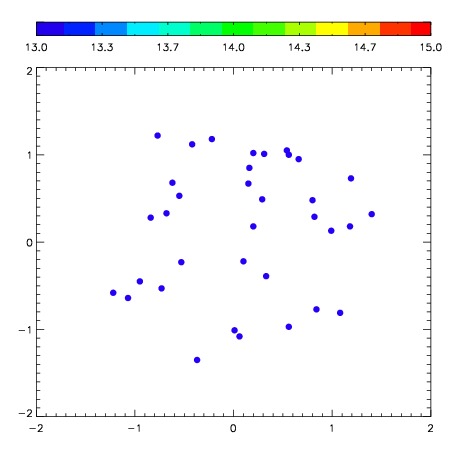

| Frame | Nreads | Zeropoints | Mag plots | Spatial mag deviation | Spatial sky 16325A emission deviations (filled: sky, open: star) | Spatial sky continuum emission | Spatial sky telluric CO2 absorption deviations (filled: H < 10) | |||||||||||||||||||||||
| 0 | 0 |
|
|
|
|
|
|
| IPAIR | NAME | SHIFT | NEWSHIFT | S/N | NAME | SHIFT | NEWSHIFT | S/N |
| 0 | 03750108 | 0.446256 | 0.00000 | 262.123 | 03750110 | -0.0100086 | 0.456265 | 261.172 |
| 1 | 03750109 | 0.435834 | 0.0104220 | 263.604 | 03750107 | -0.0114460 | 0.457702 | 262.898 |
| 2 | 03750104 | 0.439974 | 0.00628200 | 254.039 | 03750103 | 0.00000 | 0.446256 | 258.539 |
| 3 | 03750105 | 0.440983 | 0.00527301 | 247.726 | 03750106 | -0.00827301 | 0.454529 | 252.594 |