| Red | Green | Blue | |
| z | 17.64 | ||
| znorm | Inf | ||
| sky | -NaN | -Inf | -Inf |
| S/N | 25.8 | 42.8 | 51.1 |
| S/N(c) | 0.0 | 0.0 | 0.0 |
| SN(E/C) |

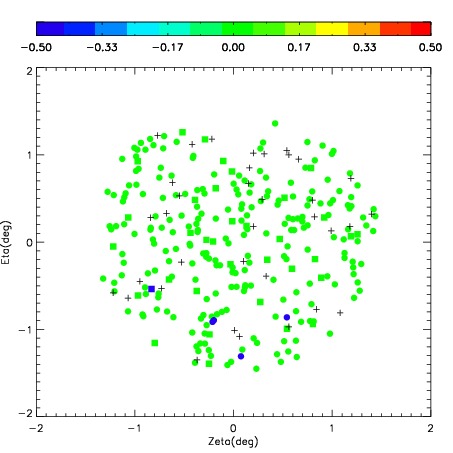
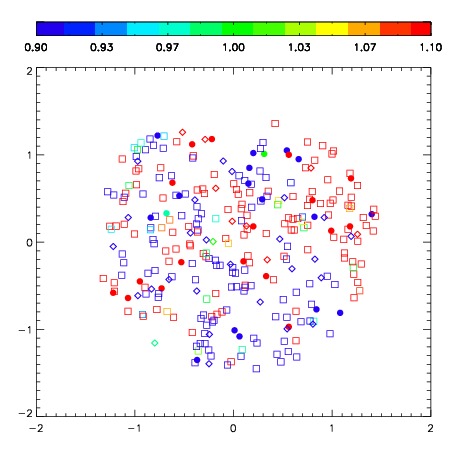

| Frame | Nreads | Zeropoints | Mag plots | Spatial mag deviation | Spatial sky 16325A emission deviations (filled: sky, open: star) | Spatial sky continuum emission | Spatial sky telluric CO2 absorption deviations (filled: H < 10) | |||||||||||||||||||||||
| 0 | 0 |
|
|
|
|
|
|
| IPAIR | NAME | SHIFT | NEWSHIFT | S/N | NAME | SHIFT | NEWSHIFT | S/N |
| 0 | 04290062 | 0.480143 | 0.00000 | 254.661 | 04290063 | 0.0183086 | 0.461834 | 259.900 |
| 1 | 04290061 | 0.477037 | 0.00310600 | 241.818 | 04290060 | 0.0184979 | 0.461645 | 239.573 |
| 2 | 04290057 | 0.476806 | 0.00333700 | 236.562 | 04290059 | 0.0110049 | 0.469138 | 236.057 |
| 3 | 04290058 | 0.478488 | 0.00165501 | 235.929 | 04290056 | 0.00000 | 0.480143 | 226.782 |