| Red | Green | Blue | |
| z | 17.64 | ||
| znorm | Inf | ||
| sky | -NaN | -Inf | -Inf |
| S/N | 26.9 | 49.1 | 55.3 |
| S/N(c) | 0.0 | 0.0 | 0.0 |
| SN(E/C) |

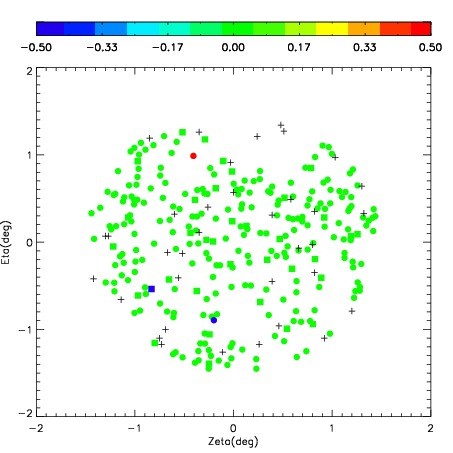
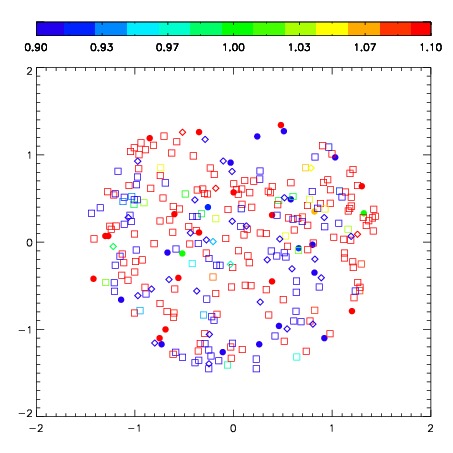
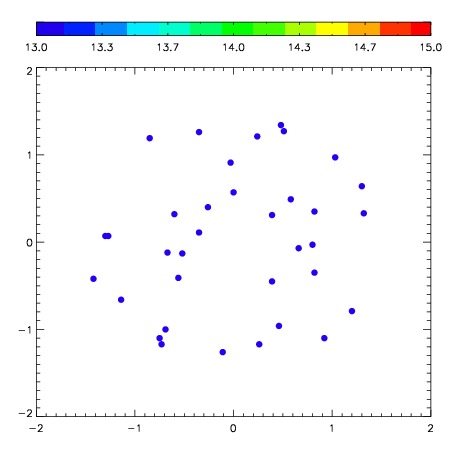
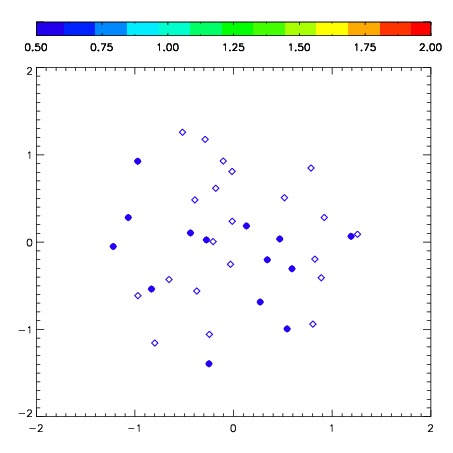
| Frame | Nreads | Zeropoints | Mag plots | Spatial mag deviation | Spatial sky 16325A emission deviations (filled: sky, open: star) | Spatial sky continuum emission | Spatial sky telluric CO2 absorption deviations (filled: H < 10) | |||||||||||||||||||||||
| 0 | 0 |
|
|
|
|
|
|
| IPAIR | NAME | SHIFT | NEWSHIFT | S/N | NAME | SHIFT | NEWSHIFT | S/N |
| 0 | 04560049 | 0.464971 | 0.00000 | 300.282 | 04560051 | 0.0180420 | 0.446929 | 301.919 |
| 1 | 04560048 | 0.459067 | 0.00590402 | 297.978 | 04560054 | 0.0167616 | 0.448209 | 297.173 |
| 2 | 04560053 | 0.459893 | 0.00507802 | 292.193 | 04560050 | 0.0148843 | 0.450087 | 296.286 |
| 3 | 04560052 | 0.460458 | 0.00451300 | 291.821 | 04560047 | 0.00000 | 0.464971 | 291.563 |