| Red | Green | Blue | |
| z | 17.64 | ||
| znorm | Inf | ||
| sky | -Inf | -NaN | -Inf |
| S/N | 25.6 | 46.5 | 50.4 |
| S/N(c) | 0.0 | 0.0 | 0.0 |
| SN(E/C) |

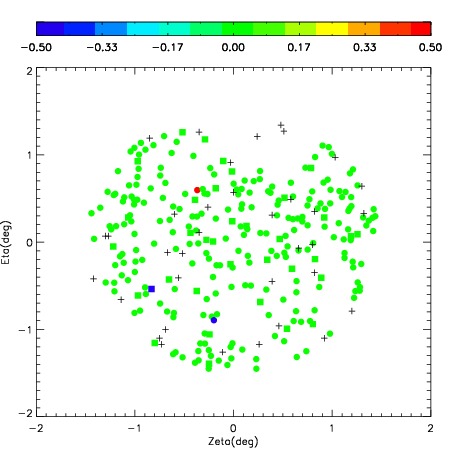
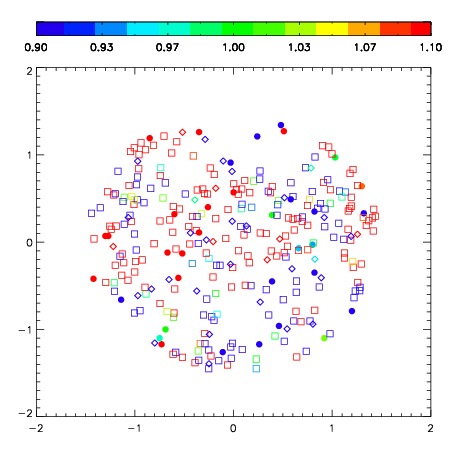
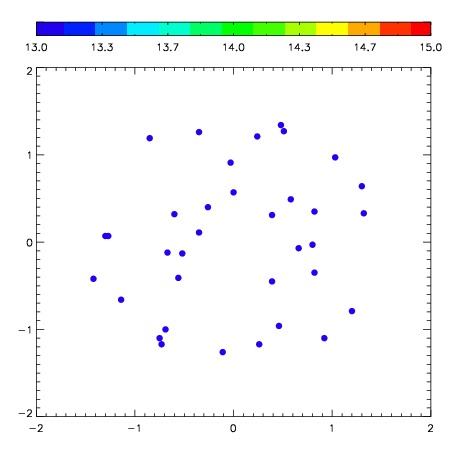
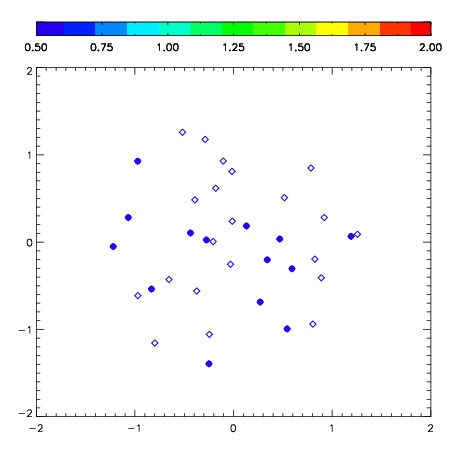
| Frame | Nreads | Zeropoints | Mag plots | Spatial mag deviation | Spatial sky 16325A emission deviations (filled: sky, open: star) | Spatial sky continuum emission | Spatial sky telluric CO2 absorption deviations (filled: H < 10) | |||||||||||||||||||||||
| 0 | 0 |
|
|
|
|
|
|
| IPAIR | NAME | SHIFT | NEWSHIFT | S/N | NAME | SHIFT | NEWSHIFT | S/N |
| 0 | 04860029 | 0.508658 | 0.00000 | 281.922 | 04860031 | 0.0362507 | 0.472407 | 284.704 |
| 1 | 04860034 | 0.499505 | 0.00915298 | 291.327 | 04860035 | 0.0367008 | 0.471957 | 287.838 |
| 2 | 04860030 | 0.504647 | 0.00401098 | 287.239 | 04860032 | 0.0322989 | 0.476359 | 286.560 |
| 3 | 04860033 | 0.503960 | 0.00469798 | 281.016 | 04860028 | 0.00000 | 0.508658 | 278.014 |