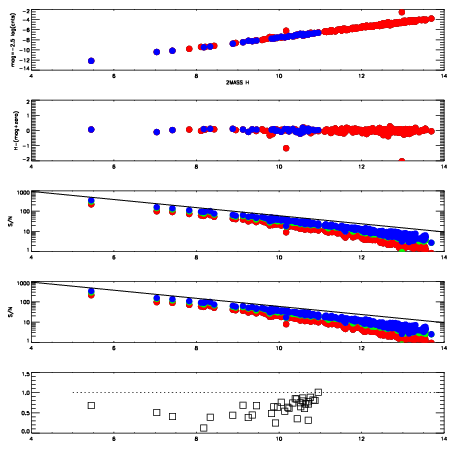
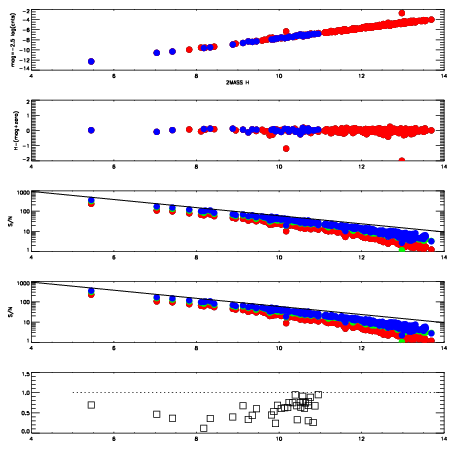
| Frame | Nreads | Zeropoints | Mag plots
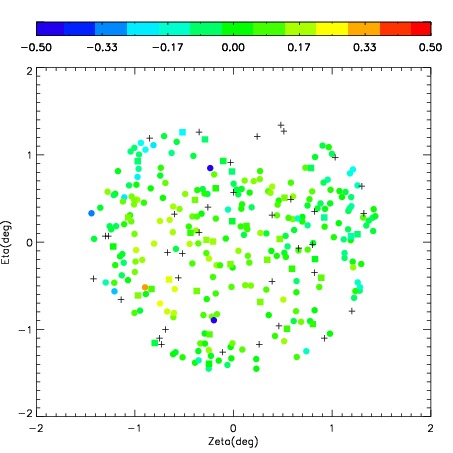
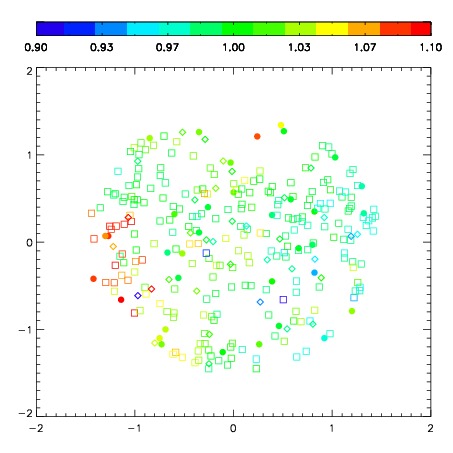
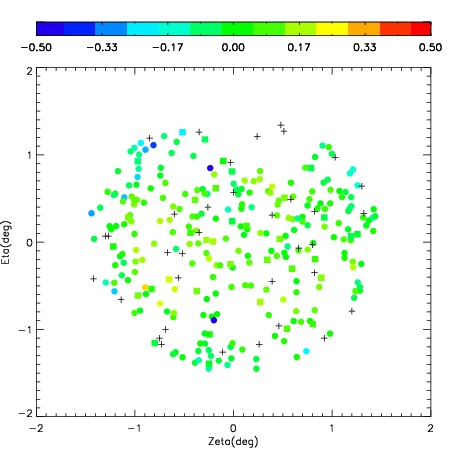
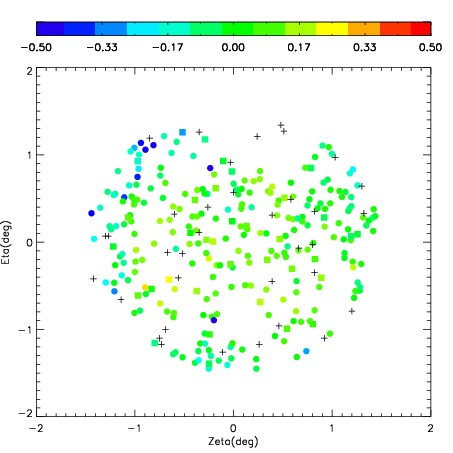
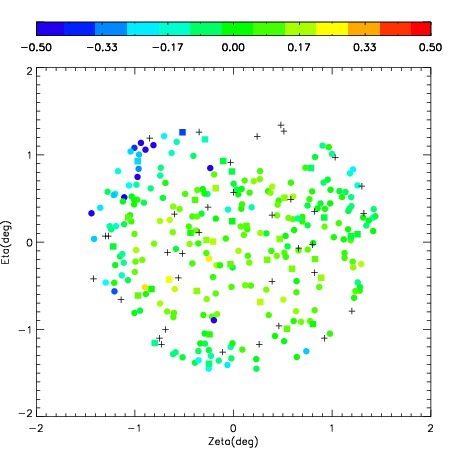
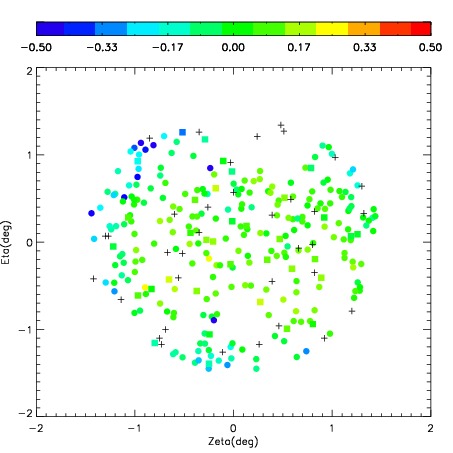
| Spatial mag deviation
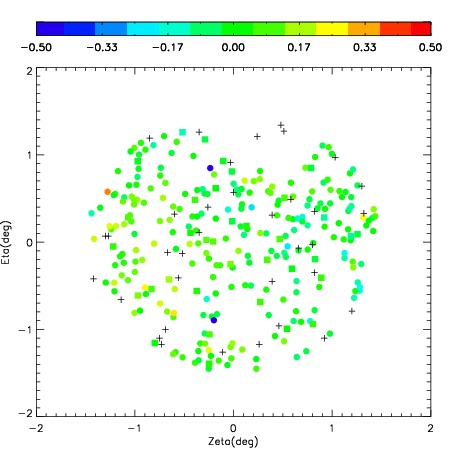
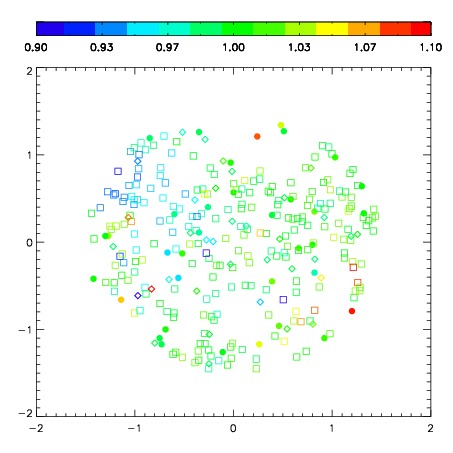
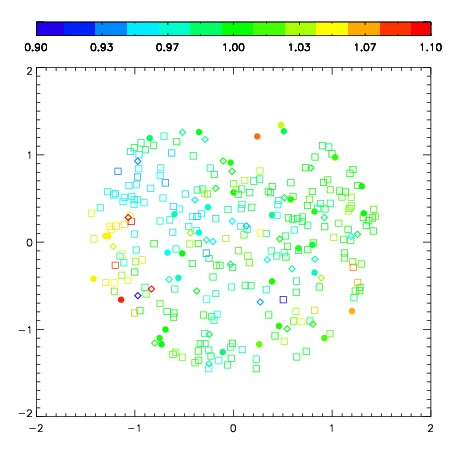
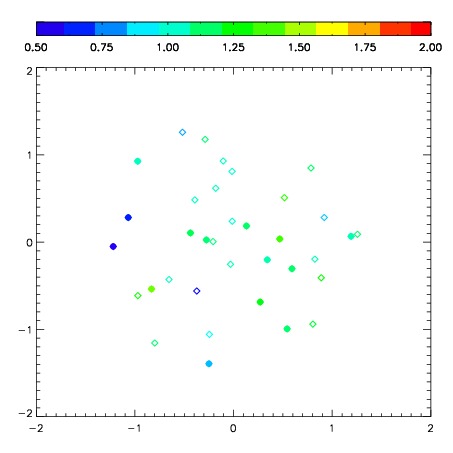
| Spatial sky 16325A emission deviations (filled: sky, open: star)
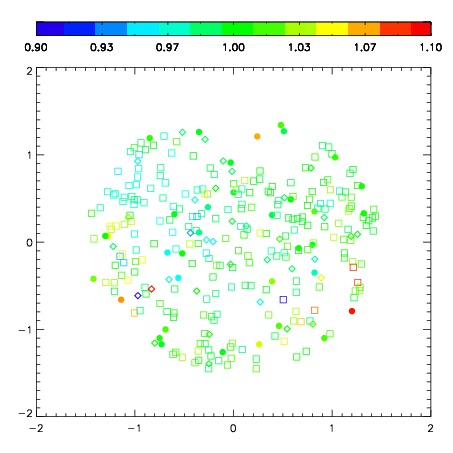
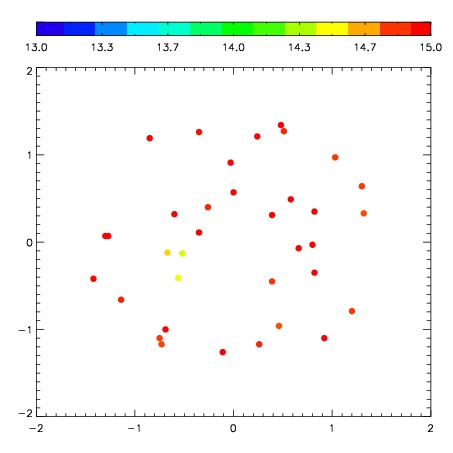
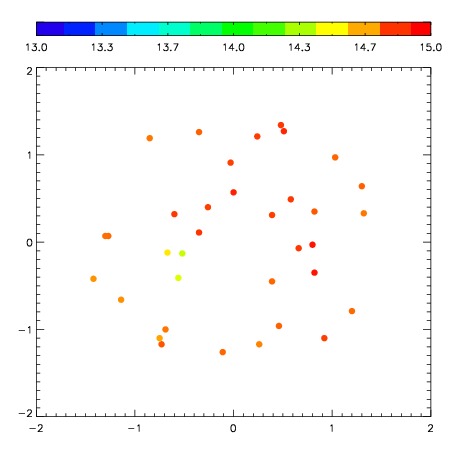
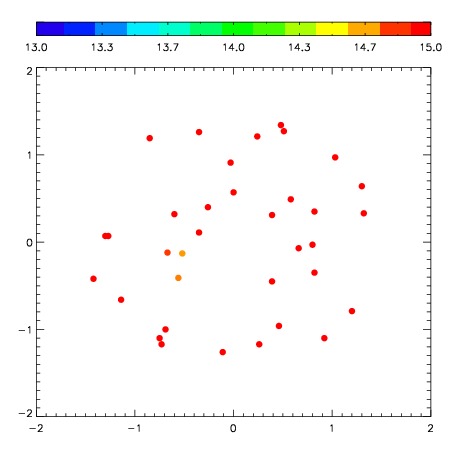
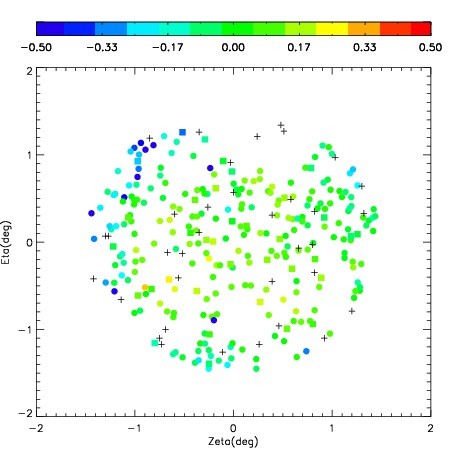
| Spatial sky continuum emission
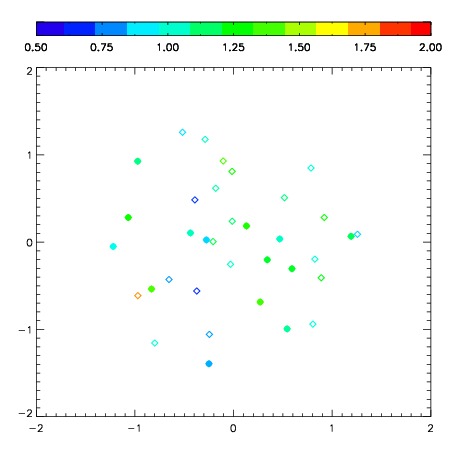
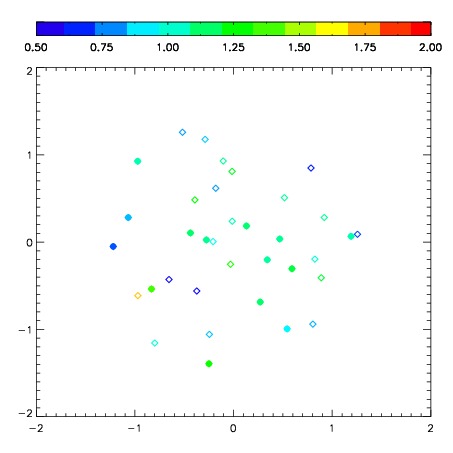
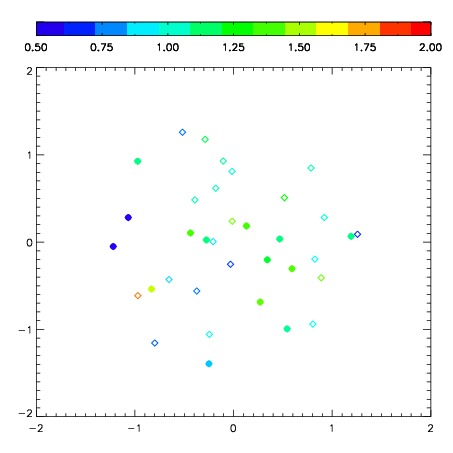
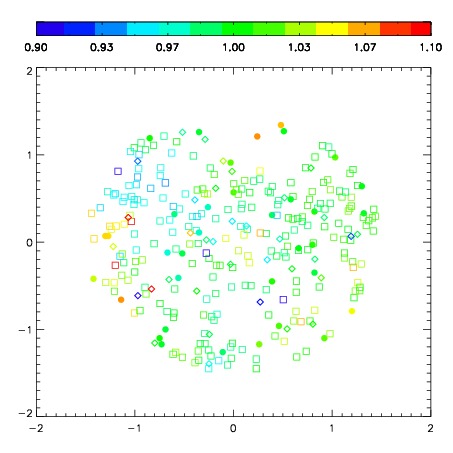
| Spatial sky telluric CO2 absorption deviations (filled: H < 10)
|
| 8130016
| 47
| | Red | Green | Blue
| | z | | 17.24
| | znorm | | 13.06
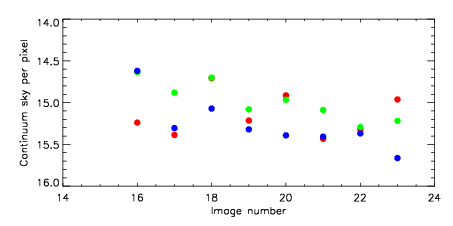
| | sky | 15.2 | 14.6 | 14.6
| | S/N | 3.9 | 8.2 | 9.5
| | S/N(c) | 3.4 | 7.6 | 8.8
| | SN(E/C) 0.75
|
| 
| 
| 
| 
| 
|
| 8130017
| 47
| | Red | Green | Blue
| | z | | 17.77
| | znorm | | 13.59
| | sky | 15.4 | 14.9 | 15.3
| | S/N | 6.0 | 11.5 | 12.3
| | S/N(c) | 5.0 | 10.3 | 11.4
| | SN(E/C) 0.66
|
| 
| 
| 
| 
| 
|
| 8130018
| 47
| | Red | Green | Blue
| | z | | 17.54
| | znorm | | 13.36
| | sky | 14.7 | 14.7 | 15.1
| | S/N | 4.6 | 9.9 | 11.3
| | S/N(c) | 4.1 | 9.0 | 10.5
| | SN(E/C) 0.65
|
| 
| 
| 
| 
| 
|
| 8130019
| 47
| | Red | Green | Blue
| | z | | 17.70
| | znorm | | 13.52
| | sky | 15.2 | 15.1 | 15.3
| | S/N | 5.6 | 11.2 | 12.3
| | S/N(c) | 4.9 | 10.1 | 11.3
| | SN(E/C) 0.63
|
| 
| 
| 
| 
| 
|
| 8130020
| 47
| | Red | Green | Blue
| | z | | 17.99
| | znorm | | 13.81
| | sky | 14.9 | 15.0 | 15.4
| | S/N | 6.8 | 13.8 | 14.6
| | S/N(c) | 5.9 | 12.2 | 13.5
| | SN(E/C) 0.60
|
| 
| 
| 
| 
| 
|
| 8130021
| 47
| | Red | Green | Blue
| | z | | 18.03
| | znorm | | 13.85
| | sky | 15.4 | 15.1 | 15.4
| | S/N | 7.2 | 14.2 | 14.5
| | S/N(c) | 6.3 | 12.9 | 13.6
| | SN(E/C) 0.57
|
| 
| 
| 
| 
| 
|
| 8130022
| 47
| | Red | Green | Blue
| | z | | 17.93
| | znorm | | 13.74
| | sky | 15.3 | 15.3 | 15.4
| | S/N | 6.7 | 13.3 | 13.8
| | S/N(c) | 5.9 | 12.0 | 12.9
| | SN(E/C) 0.59
|
| 
| 
| 
| 
| 
|
| 8130023
| 47
| | Red | Green | Blue
| | z | | 17.79
| | znorm | | 13.61
| | sky | 15.0 | 15.2 | 15.7
| | S/N | 6.1 | 12.2 | 12.9
| | S/N(c) | 5.2 | 11.1 | 11.8
| | SN(E/C) 0.65
|
| 
| 
| 
| 
| 
|