| Red | Green | Blue | |
| z | 17.64 | ||
| znorm | Inf | ||
| sky | -NaN | -Inf | -Inf |
| S/N | 10.2 | 21.6 | 24.0 |
| S/N(c) | 0.0 | 0.0 | 0.0 |
| SN(E/C) |

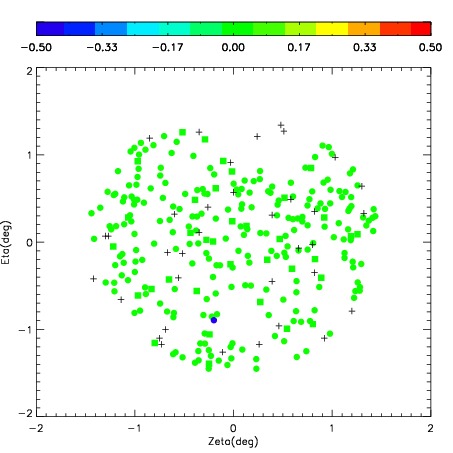
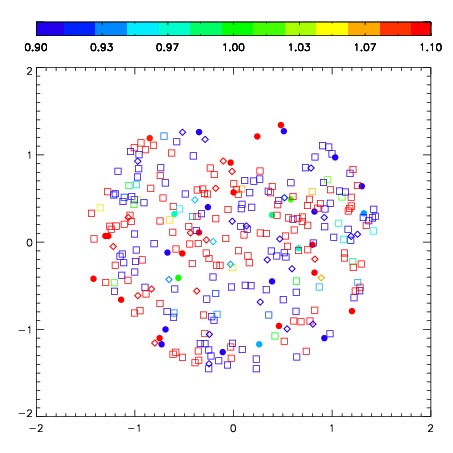
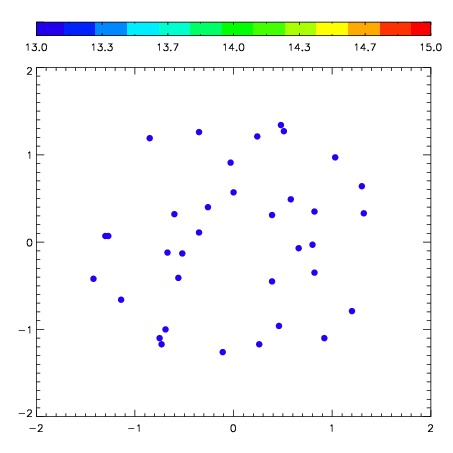
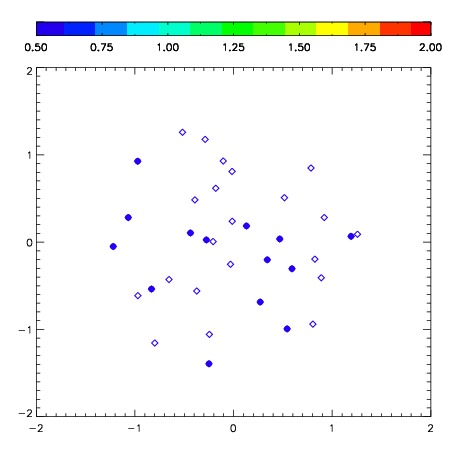
| Frame | Nreads | Zeropoints | Mag plots | Spatial mag deviation | Spatial sky 16325A emission deviations (filled: sky, open: star) | Spatial sky continuum emission | Spatial sky telluric CO2 absorption deviations (filled: H < 10) | |||||||||||||||||||||||
| 0 | 0 |
|
|
|
|
|
|
| IPAIR | NAME | SHIFT | NEWSHIFT | S/N | NAME | SHIFT | NEWSHIFT | S/N |
| 0 | 08130018 | 0.488283 | 0.00000 | 140.731 | 08130016 | 0.00000 | 0.488283 | 120.952 |
| 1 | 08130021 | 0.470856 | 0.0174270 | 175.773 | 08130020 | -0.0112053 | 0.499488 | 173.581 |
| 2 | 08130022 | 0.477230 | 0.0110530 | 170.316 | 08130023 | -0.0148391 | 0.503122 | 160.861 |
| 3 | 08130017 | 0.476732 | 0.0115510 | 152.106 | 08130019 | -0.0129868 | 0.501270 | 152.116 |