| Red | Green | Blue | |
| z | 17.64 | ||
| znorm | Inf | ||
| sky | -NaN | -Inf | -Inf |
| S/N | 16.7 | 31.3 | 33.4 |
| S/N(c) | 0.0 | 0.0 | 0.0 |
| SN(E/C) |
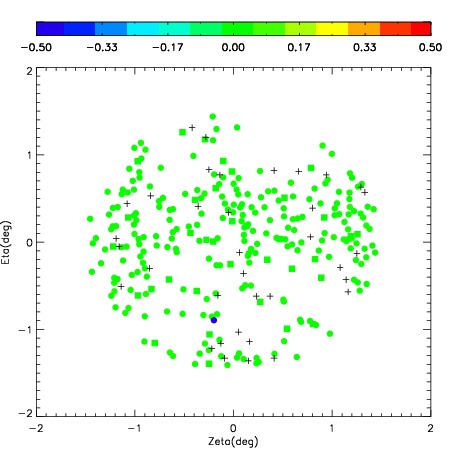
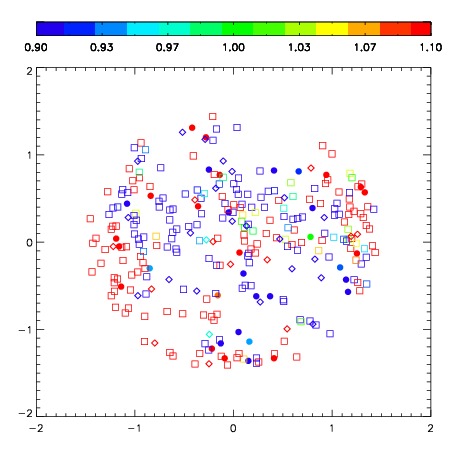


| Frame | Nreads | Zeropoints | Mag plots | Spatial mag deviation | Spatial sky 16325A emission deviations (filled: sky, open: star) | Spatial sky continuum emission | Spatial sky telluric CO2 absorption deviations (filled: H < 10) | |||||||||||||||||||||||
| 0 | 0 |
|
|
|
|
|
|
| IPAIR | NAME | SHIFT | NEWSHIFT | S/N | NAME | SHIFT | NEWSHIFT | S/N |
| 0 | 05480015 | 0.477648 | 0.00000 | 149.493 | 05480014 | 0.0291815 | 0.448466 | 151.749 |
| 1 | 05480011 | 0.455534 | 0.0221140 | 248.732 | 05480010 | 0.00000 | 0.477648 | 243.230 |
| 2 | 05480012 | 0.461333 | 0.0163150 | 239.561 | 05480013 | 0.0280095 | 0.449638 | 217.681 |
| 3 | 05480016 | 0.477500 | 0.000147998 | 184.909 | 05480017 | 0.0349084 | 0.442740 | 185.672 |