| Red | Green | Blue | |
| z | 17.64 | ||
| znorm | Inf | ||
| sky | -Inf | -Inf | -Inf |
| S/N | 18.1 | 32.9 | 39.4 |
| S/N(c) | 0.0 | 0.0 | 0.0 |
| SN(E/C) |

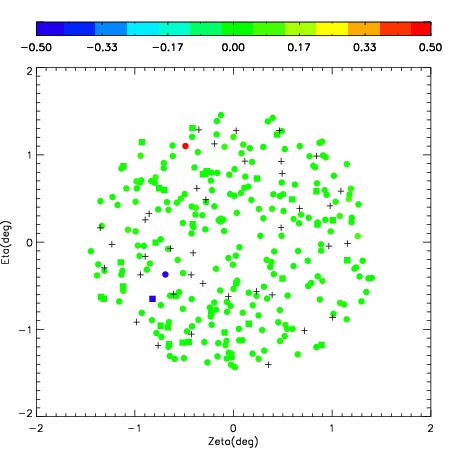
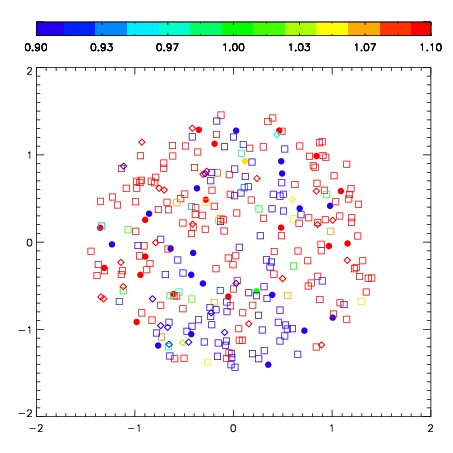
| Frame | Nreads | Zeropoints | Mag plots | Spatial mag deviation | Spatial sky 16325A emission deviations (filled: sky, open: star) | Spatial sky continuum emission | Spatial sky telluric CO2 absorption deviations (filled: H < 10) | |||||||||||||||||||||||
| 0 | 0 |
|
|
|
|
|
|
| IPAIR | NAME | SHIFT | NEWSHIFT | S/N | NAME | SHIFT | NEWSHIFT | S/N |
| 0 | 03720088 | 0.628887 | 0.00000 | 251.646 | 03720090 | 0.122967 | 0.505920 | 259.549 |
| 1 | 03720091 | 0.626277 | 0.00260997 | 261.514 | 03720089 | 0.125778 | 0.503109 | 259.812 |
| 2 | 03720087 | 0.615035 | 0.0138520 | 250.660 | 03720086 | 0.00000 | 0.628887 | 245.690 |
| 3 | 03720092 | 0.621721 | 0.00716597 | 245.673 | 03720093 | 0.124201 | 0.504686 | 238.032 |