| Red | Green | Blue | |
| z | 17.64 | ||
| znorm | Inf | ||
| sky | -Inf | -Inf | -Inf |
| S/N | 9.8 | 18.2 | 22.7 |
| S/N(c) | 0.0 | 0.0 | 0.0 |
| SN(E/C) |


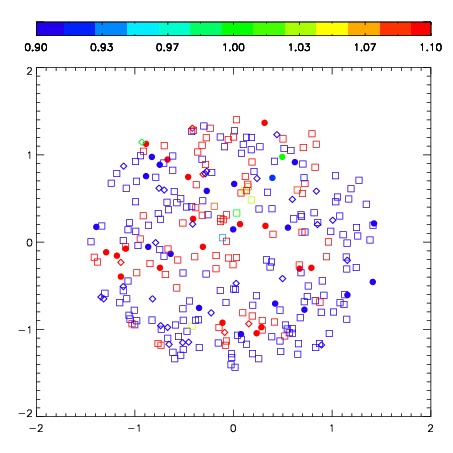

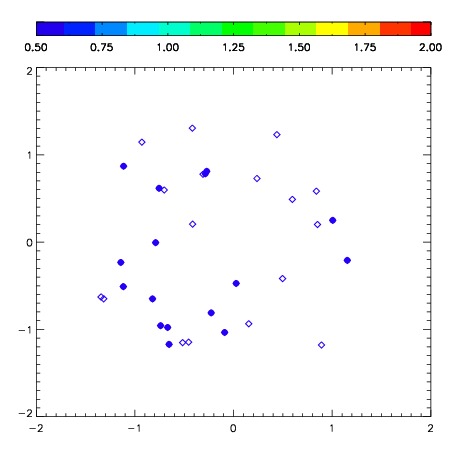
| Frame | Nreads | Zeropoints | Mag plots | Spatial mag deviation | Spatial sky 16325A emission deviations (filled: sky, open: star) | Spatial sky continuum emission | Spatial sky telluric CO2 absorption deviations (filled: H < 10) | |||||||||||||||||||||||
| 0 | 0 |
|
|
|
|
|
|
| IPAIR | NAME | SHIFT | NEWSHIFT | S/N | NAME | SHIFT | NEWSHIFT | S/N |
| 0 | 07630049 | 0.543510 | 0.00000 | 105.322 | 07630047 | 0.120605 | 0.422905 | 116.322 |
| 1 | 07630045 | 0.499124 | 0.0443860 | 153.145 | 07630043 | 0.00000 | 0.543510 | 139.067 |
| 2 | 07630044 | 0.502407 | 0.0411030 | 144.577 | 07630046 | 0.103104 | 0.440406 | 127.818 |
| 3 | 07630048 | 0.523624 | 0.0198860 | 104.102 | 07630050 | 0.110588 | 0.432922 | 87.7367 |