| Red | Green | Blue | |
| z | 17.64 | ||
| znorm | Inf | ||
| sky | -NaN | -Inf | -Inf |
| S/N | 24.3 | 42.8 | 48.2 |
| S/N(c) | 0.0 | 0.0 | 0.0 |
| SN(E/C) |


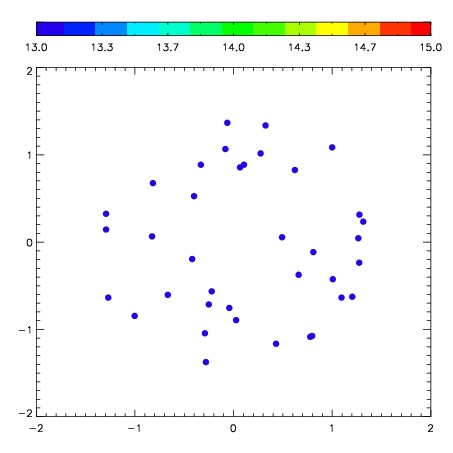
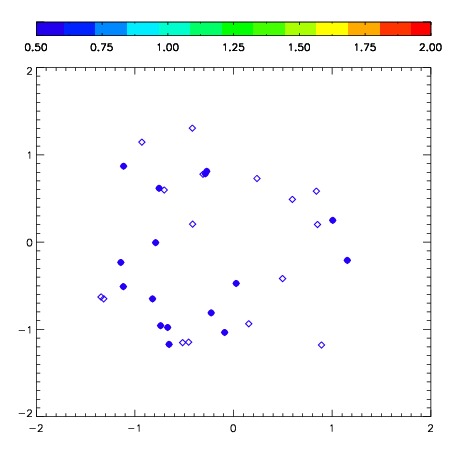
| Frame | Nreads | Zeropoints | Mag plots | Spatial mag deviation | Spatial sky 16325A emission deviations (filled: sky, open: star) | Spatial sky continuum emission | Spatial sky telluric CO2 absorption deviations (filled: H < 10) | |||||||||||||||||||||||
| 0 | 0 |
|
|
|
|
|
|
| IPAIR | NAME | SHIFT | NEWSHIFT | S/N | NAME | SHIFT | NEWSHIFT | S/N |
| 0 | 08410042 | 0.498069 | 0.00000 | 198.368 | 08410040 | 0.0253645 | 0.472704 | 196.559 |
| 1 | 08410043 | 0.494597 | 0.00347200 | 198.937 | 08410044 | 0.0313435 | 0.466725 | 197.155 |
| 2 | 08410039 | 0.490271 | 0.00779799 | 195.183 | 08410041 | 0.0260620 | 0.472007 | 196.088 |
| 3 | 08410038 | 0.497127 | 0.000941992 | 190.448 | 08410037 | 0.00000 | 0.498069 | 192.230 |