| Red | Green | Blue | |
| z | 17.64 | ||
| znorm | Inf | ||
| sky | -NaN | -Inf | -Inf |
| S/N | 21.4 | 39.3 | 46.6 |
| S/N(c) | 0.0 | 0.0 | 0.0 |
| SN(E/C) |


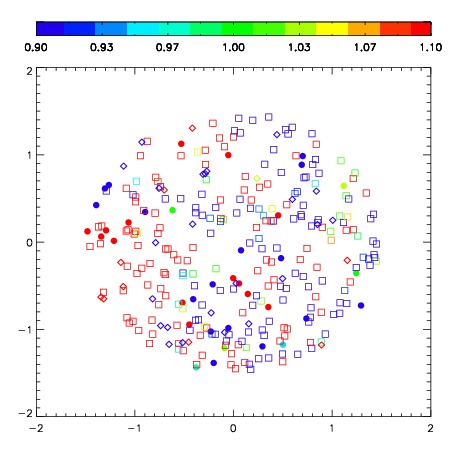


| Frame | Nreads | Zeropoints | Mag plots | Spatial mag deviation | Spatial sky 16325A emission deviations (filled: sky, open: star) | Spatial sky continuum emission | Spatial sky telluric CO2 absorption deviations (filled: H < 10) | |||||||||||||||||||||||
| 0 | 0 |
|
|
|
|
|
|
| IPAIR | NAME | SHIFT | NEWSHIFT | S/N | NAME | SHIFT | NEWSHIFT | S/N |
| 0 | 08420039 | 0.518619 | 0.00000 | 212.447 | 08420040 | 0.0345211 | 0.484098 | 212.391 |
| 1 | 08420042 | 0.510823 | 0.00779599 | 212.936 | 08420044 | 0.0357625 | 0.482857 | 215.249 |
| 2 | 08420043 | 0.514869 | 0.00375003 | 212.699 | 08420041 | 0.0302175 | 0.488402 | 212.560 |
| 3 | 08420038 | 0.516461 | 0.00215799 | 207.313 | 08420037 | 0.00000 | 0.518619 | 209.092 |