| Red | Green | Blue | |
| z | 17.64 | ||
| znorm | Inf | ||
| sky | -NaN | -NaN | -Inf |
| S/N | 17.8 | 32.1 | 34.3 |
| S/N(c) | 0.0 | 0.0 | 0.0 |
| SN(E/C) |

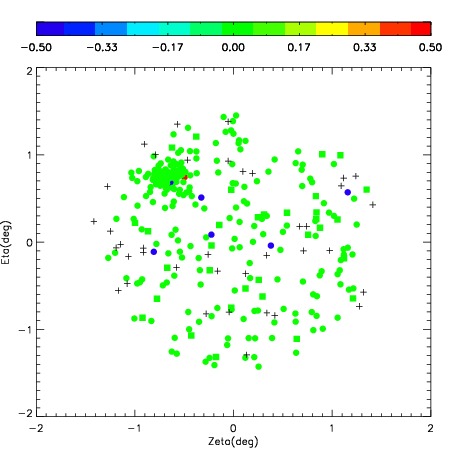
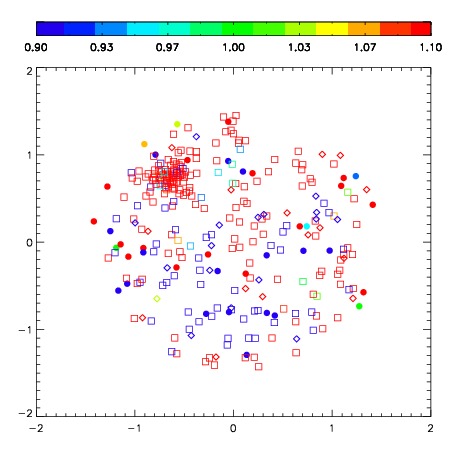
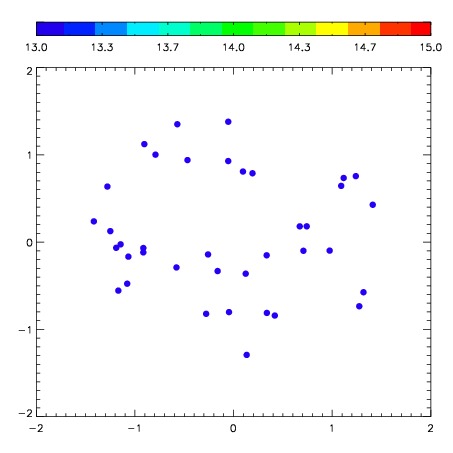
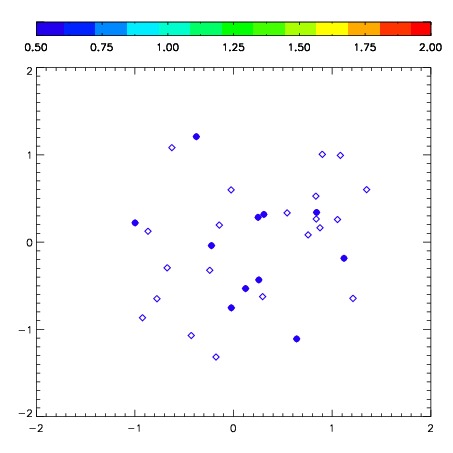
| Frame | Nreads | Zeropoints | Mag plots | Spatial mag deviation | Spatial sky 16325A emission deviations (filled: sky, open: star) | Spatial sky continuum emission | Spatial sky telluric CO2 absorption deviations (filled: H < 10) | |||||||||||||||||||||||
| 0 | 0 |
|
|
|
|
|
|
| IPAIR | NAME | SHIFT | NEWSHIFT | S/N | NAME | SHIFT | NEWSHIFT | S/N |
| 0 | 03750093 | 0.529087 | 0.00000 | 200.127 | 03750096 | 0.0538943 | 0.475193 | 199.044 |
| 1 | 03750094 | 0.526051 | 0.00303602 | 215.918 | 03750099 | 0.0529166 | 0.476170 | 207.338 |
| 2 | 03750098 | 0.525420 | 0.00366700 | 205.169 | 03750095 | 0.0502845 | 0.478803 | 204.757 |
| 3 | 03750097 | 0.527835 | 0.00125200 | 200.387 | 03750092 | 0.00000 | 0.529087 | 203.041 |