| Red | Green | Blue | |
| z | 17.64 | ||
| znorm | Inf | ||
| sky | -NaN | -Inf | -Inf |
| S/N | 24.6 | 44.0 | 50.4 |
| S/N(c) | 0.0 | 0.0 | 0.0 |
| SN(E/C) |

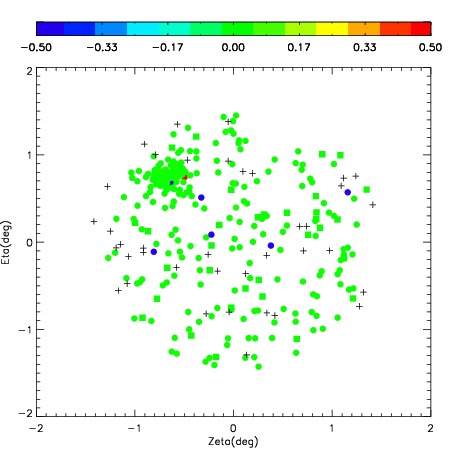

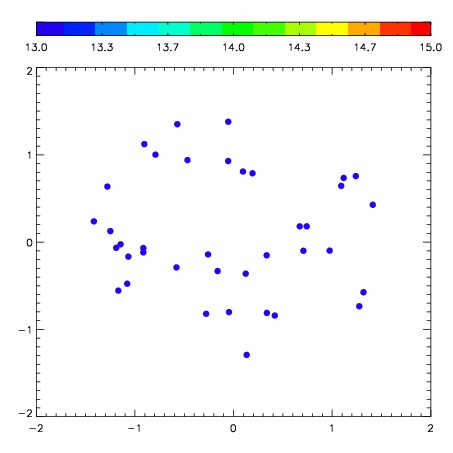
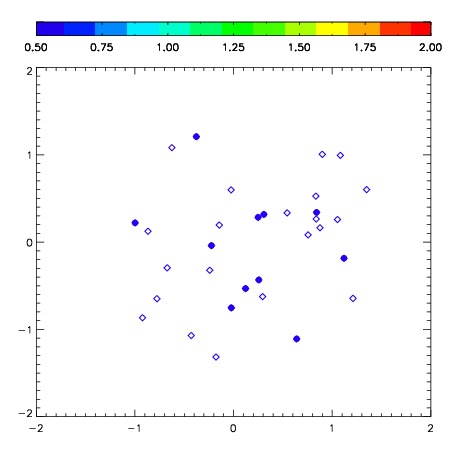
| Frame | Nreads | Zeropoints | Mag plots | Spatial mag deviation | Spatial sky 16325A emission deviations (filled: sky, open: star) | Spatial sky continuum emission | Spatial sky telluric CO2 absorption deviations (filled: H < 10) | |||||||||||||||||||||||
| 0 | 0 |
|
|
|
|
|
|
| IPAIR | NAME | SHIFT | NEWSHIFT | S/N | NAME | SHIFT | NEWSHIFT | S/N |
| 0 | 03780064 | 0.564101 | 0.00000 | 213.437 | 03780065 | 0.0661150 | 0.497986 | 216.231 |
| 1 | 03780068 | 0.555554 | 0.00854701 | 227.387 | 03780069 | 0.0660186 | 0.498082 | 223.448 |
| 2 | 03780067 | 0.558986 | 0.00511497 | 219.436 | 03780066 | 0.0672435 | 0.496857 | 218.287 |
| 3 | 03780063 | 0.561553 | 0.00254798 | 206.580 | 03780062 | 0.0638073 | 0.500294 | 201.673 |
| 4 | 03780059 | 0.558031 | 0.00606996 | 194.544 | 03780058 | 0.00000 | 0.564101 | 199.592 |
| 5 | 03780060 | 0.555328 | 0.00877297 | 192.975 | 03780061 | 0.0650010 | 0.499100 | 198.602 |