| Red | Green | Blue | |
| z | 17.63 | ||
| znorm | Inf | ||
| sky | -NaN | -NaN | -Inf |
| S/N | 27.3 | 44.8 | 52.6 |
| S/N(c) | 0.0 | 0.0 | 0.0 |
| SN(E/C) |

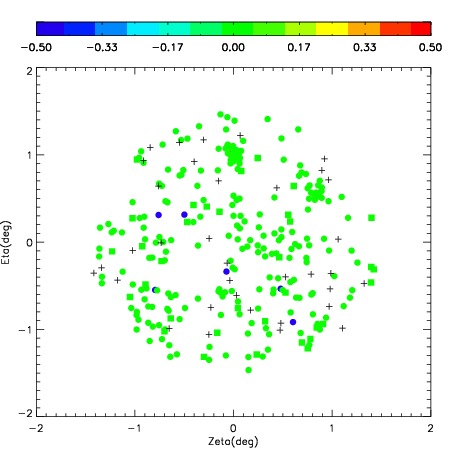
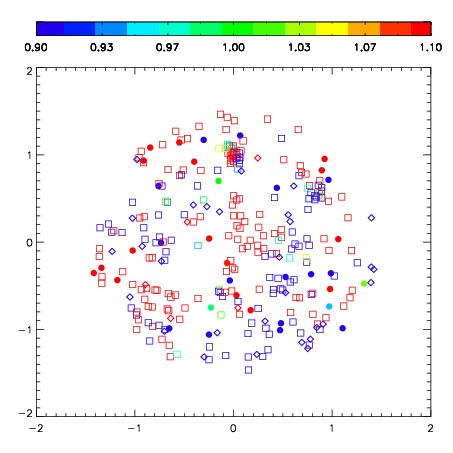
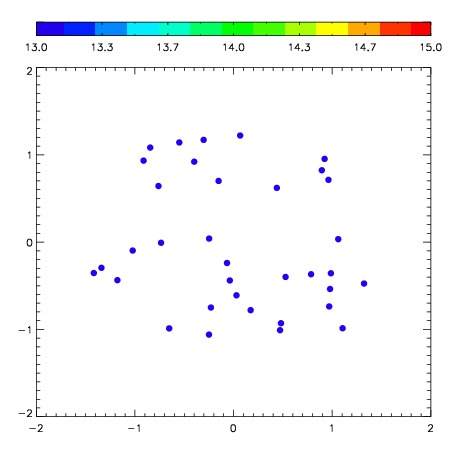
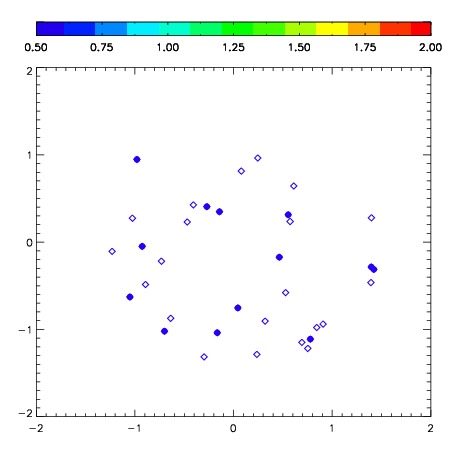
| Frame | Nreads | Zeropoints | Mag plots | Spatial mag deviation | Spatial sky 16325A emission deviations (filled: sky, open: star) | Spatial sky continuum emission | Spatial sky telluric CO2 absorption deviations (filled: H < 10) | |||||||||||||||||||||||
| 0 | 0 |
|
|
|
|
|
|
| IPAIR | NAME | SHIFT | NEWSHIFT | S/N | NAME | SHIFT | NEWSHIFT | S/N |
| 0 | 04290068 | 0.506309 | 0.00000 | 267.543 | 04290071 | 0.0277298 | 0.478579 | 267.931 |
| 1 | 04290073 | 0.496566 | 0.00974298 | 266.168 | 04290070 | 0.0290746 | 0.477234 | 267.425 |
| 2 | 04290072 | 0.476850 | 0.0294590 | 265.957 | 04290074 | 0.0268803 | 0.479429 | 265.887 |
| 3 | 04290069 | 0.493643 | 0.0126660 | 265.861 | 04290067 | 0.00000 | 0.506309 | 262.303 |