| Red | Green | Blue | |
| z | 17.64 | ||
| znorm | Inf | ||
| sky | -Inf | -Inf | -Inf |
| S/N | 22.3 | 38.9 | 46.6 |
| S/N(c) | 0.0 | 0.0 | 0.0 |
| SN(E/C) |
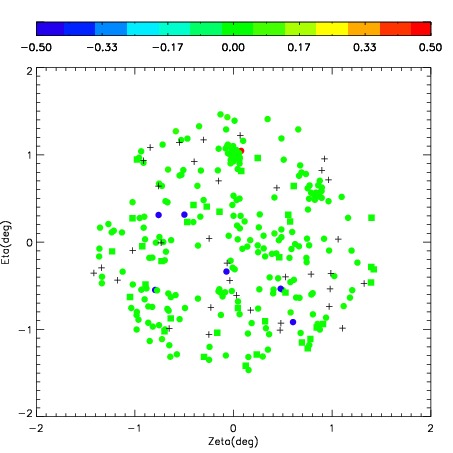
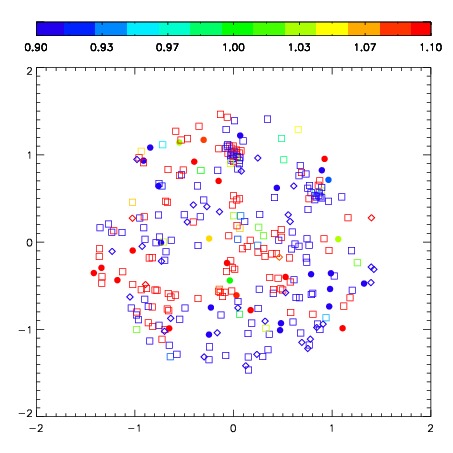


| Frame | Nreads | Zeropoints | Mag plots | Spatial mag deviation | Spatial sky 16325A emission deviations (filled: sky, open: star) | Spatial sky continuum emission | Spatial sky telluric CO2 absorption deviations (filled: H < 10) | |||||||||||||||||||||||
| 0 | 0 |
|
|
|
|
|
|
| IPAIR | NAME | SHIFT | NEWSHIFT | S/N | NAME | SHIFT | NEWSHIFT | S/N |
| 0 | 04360038 | 0.435832 | 0.00000 | 219.336 | 04360039 | -0.0151939 | 0.451026 | 232.013 |
| 1 | 04360042 | 0.424902 | 0.0109300 | 237.511 | 04360043 | -0.0145969 | 0.450429 | 249.472 |
| 2 | 04360041 | 0.426272 | 0.00955999 | 220.869 | 04360040 | -0.0163163 | 0.452148 | 237.107 |
| 3 | 04360037 | 0.434085 | 0.00174698 | 218.353 | 04360036 | 0.00000 | 0.435832 | 229.687 |