| Red | Green | Blue | |
| z | 17.64 | ||
| znorm | Inf | ||
| sky | -Inf | -Inf | -Inf |
| S/N | 21.3 | 40.1 | 42.0 |
| S/N(c) | 0.0 | 0.0 | 0.0 |
| SN(E/C) |

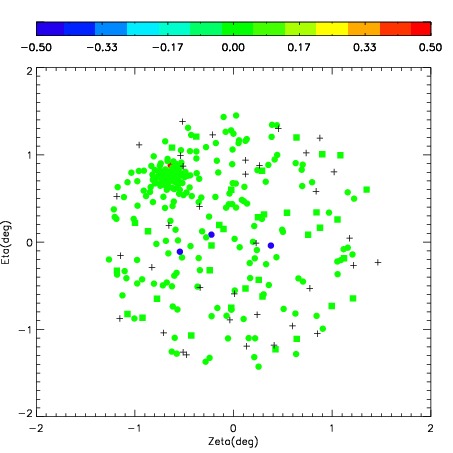
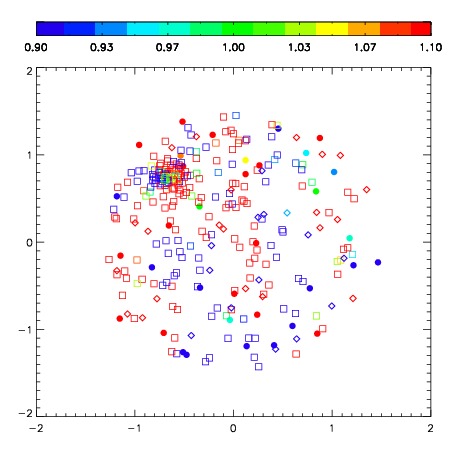


| Frame | Nreads | Zeropoints | Mag plots | Spatial mag deviation | Spatial sky 16325A emission deviations (filled: sky, open: star) | Spatial sky continuum emission | Spatial sky telluric CO2 absorption deviations (filled: H < 10) | |||||||||||||||||||||||
| 0 | 0 |
|
|
|
|
|
|
| IPAIR | NAME | SHIFT | NEWSHIFT | S/N | NAME | SHIFT | NEWSHIFT | S/N |
| 0 | 04670031 | 0.556581 | 0.00000 | 194.817 | 04670032 | 0.0568133 | 0.499768 | 188.934 |
| 1 | 04670026 | 0.550758 | 0.00582302 | 223.406 | 04670025 | 0.00000 | 0.556581 | 239.726 |
| 2 | 04670027 | 0.549480 | 0.00710100 | 221.798 | 04670029 | 0.0451550 | 0.511426 | 213.697 |
| 3 | 04670030 | 0.555188 | 0.00139302 | 207.855 | 04670028 | 0.0494042 | 0.507177 | 209.555 |