| Red | Green | Blue | |
| z | 17.64 | ||
| znorm | Inf | ||
| sky | -NaN | -Inf | -Inf |
| S/N | 25.2 | 45.8 | 52.3 |
| S/N(c) | 0.0 | 0.0 | 0.0 |
| SN(E/C) |
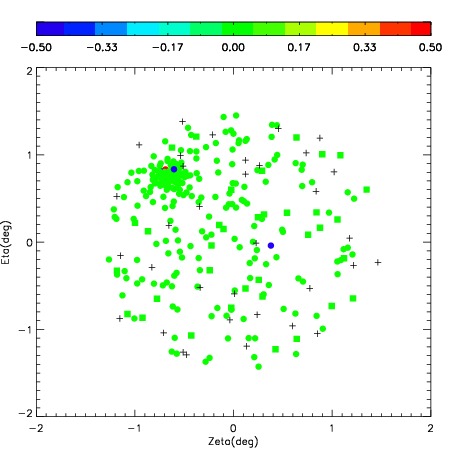
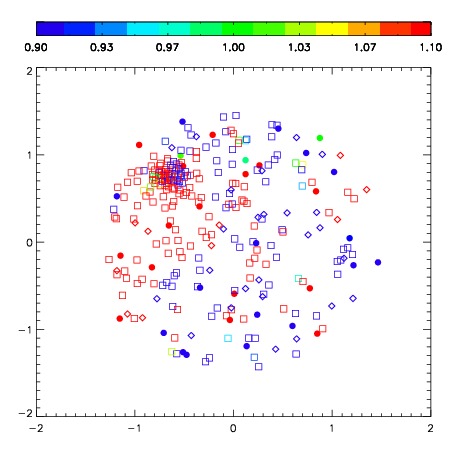


| Frame | Nreads | Zeropoints | Mag plots | Spatial mag deviation | Spatial sky 16325A emission deviations (filled: sky, open: star) | Spatial sky continuum emission | Spatial sky telluric CO2 absorption deviations (filled: H < 10) | |||||||||||||||||||||||
| 0 | 0 |
|
|
|
|
|
|
| IPAIR | NAME | SHIFT | NEWSHIFT | S/N | NAME | SHIFT | NEWSHIFT | S/N |
| 0 | 04870049 | 0.525782 | 0.00000 | 229.853 | 04870051 | 0.0575017 | 0.468280 | 239.007 |
| 1 | 04870050 | 0.523039 | 0.00274301 | 230.774 | 04870055 | 0.0567561 | 0.469026 | 239.661 |
| 2 | 04870053 | 0.521497 | 0.00428498 | 229.377 | 04870052 | 0.0600660 | 0.465716 | 235.244 |
| 3 | 04870054 | 0.519459 | 0.00632298 | 229.102 | 04870048 | 0.00000 | 0.525782 | 233.973 |