| Red | Green | Blue | |
| z | 17.64 | ||
| znorm | Inf | ||
| sky | -Inf | -NaN | -Inf |
| S/N | 28.9 | 50.7 | 58.0 |
| S/N(c) | 0.0 | 0.0 | 0.0 |
| SN(E/C) |

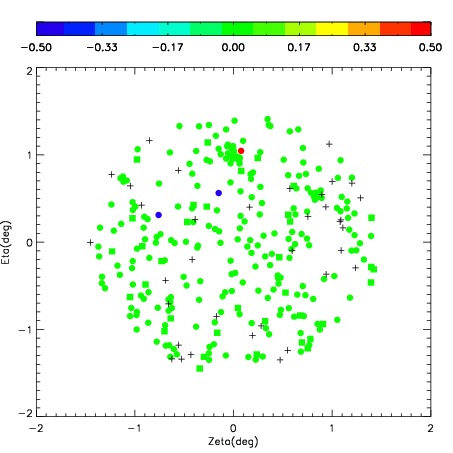
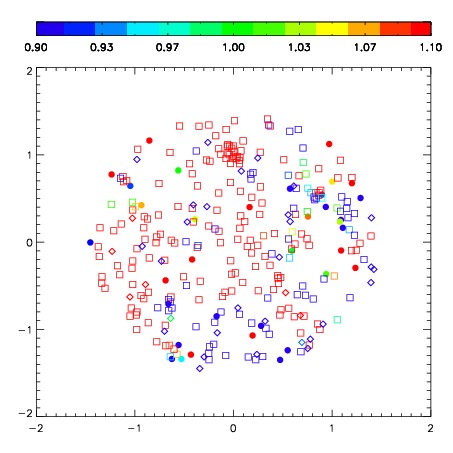
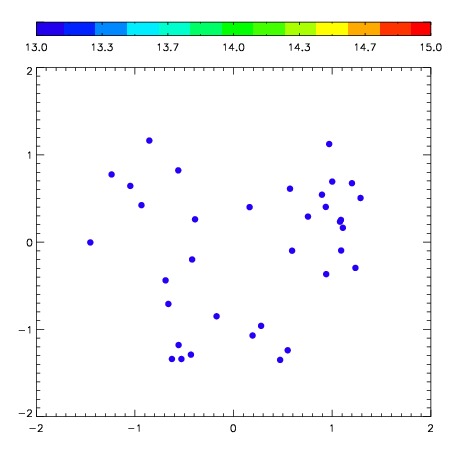
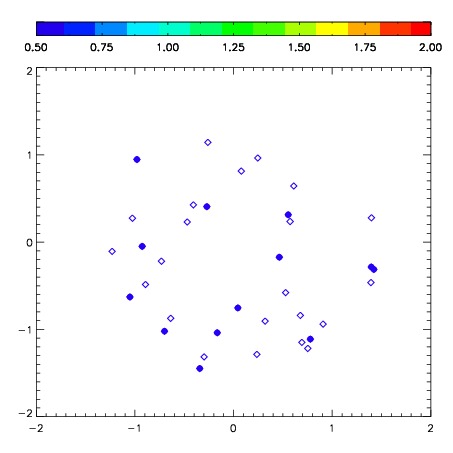
| Frame | Nreads | Zeropoints | Mag plots | Spatial mag deviation | Spatial sky 16325A emission deviations (filled: sky, open: star) | Spatial sky continuum emission | Spatial sky telluric CO2 absorption deviations (filled: H < 10) | |||||||||||||||||||||||
| 0 | 0 |
|
|
|
|
|
|
| IPAIR | NAME | SHIFT | NEWSHIFT | S/N | NAME | SHIFT | NEWSHIFT | S/N |
| 0 | 04050083 | 0.330560 | 0.00000 | 147.244 | 04050082 | 0.00000 | 0.330560 | 145.537 |
| 1 | 04050092 | 0.326659 | 0.00390100 | 165.679 | 04050093 | -0.0574110 | 0.387971 | 173.184 |
| 2 | 04050091 | 0.320502 | 0.0100580 | 159.212 | 04050090 | -0.0622189 | 0.392779 | 161.534 |
| 3 | 04050088 | 0.320733 | 0.00982699 | 151.522 | 04050089 | -0.0593458 | 0.389906 | 153.960 |
| 4 | 04050087 | 0.323006 | 0.00755399 | 151.047 | 04050085 | -0.0498737 | 0.380434 | 151.831 |
| 5 | 04050084 | 0.317197 | 0.0133630 | 150.369 | 04050086 | -0.0618396 | 0.392400 | 149.757 |