| Red | Green | Blue | |
| z | 17.64 | ||
| znorm | Inf | ||
| sky | -NaN | -Inf | -Inf |
| S/N | 26.5 | 44.9 | 49.5 |
| S/N(c) | 0.0 | 0.0 | 0.0 |
| SN(E/C) |

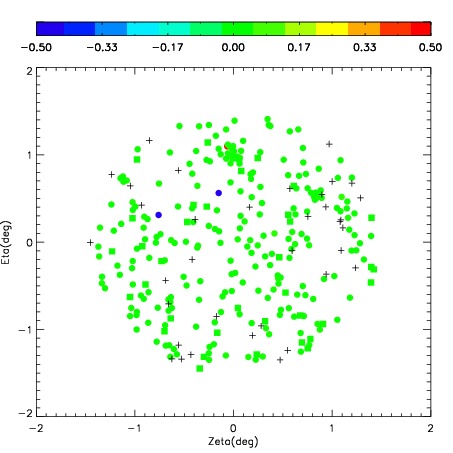
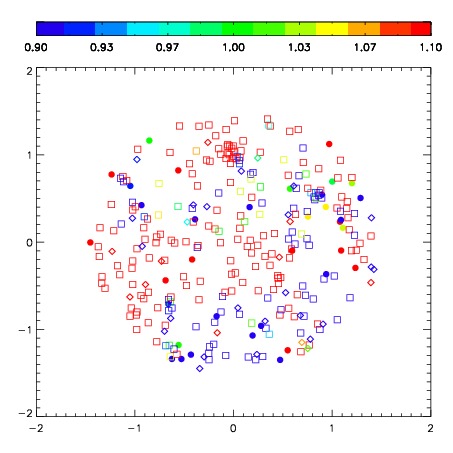
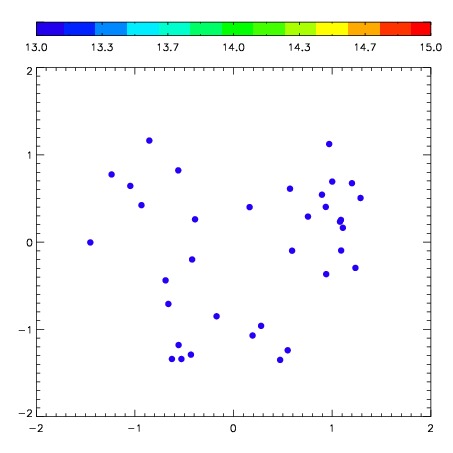

| Frame | Nreads | Zeropoints | Mag plots | Spatial mag deviation | Spatial sky 16325A emission deviations (filled: sky, open: star) | Spatial sky continuum emission | Spatial sky telluric CO2 absorption deviations (filled: H < 10) | |||||||||||||||||||||||
| 0 | 0 |
|
|
|
|
|
|
| IPAIR | NAME | SHIFT | NEWSHIFT | S/N | NAME | SHIFT | NEWSHIFT | S/N |
| 0 | 05150018 | 0.475188 | 0.00000 | 173.126 | 05150017 | 0.0153976 | 0.459790 | 169.142 |
| 1 | 05150019 | 0.473259 | 0.00192899 | 177.108 | 05150020 | 0.0130727 | 0.462115 | 178.170 |
| 2 | 05150015 | 0.469836 | 0.00535199 | 170.136 | 05150013 | 0.00000 | 0.475188 | 167.152 |
| 3 | 05150014 | 0.462299 | 0.0128890 | 168.667 | 05150016 | 0.0119442 | 0.463244 | 167.034 |