| Red | Green | Blue | |
| z | 17.64 | ||
| znorm | Inf | ||
| sky | -NaN | -NaN | -Inf |
| S/N | 21.5 | 37.9 | 41.0 |
| S/N(c) | 0.0 | 0.0 | 0.0 |
| SN(E/C) |

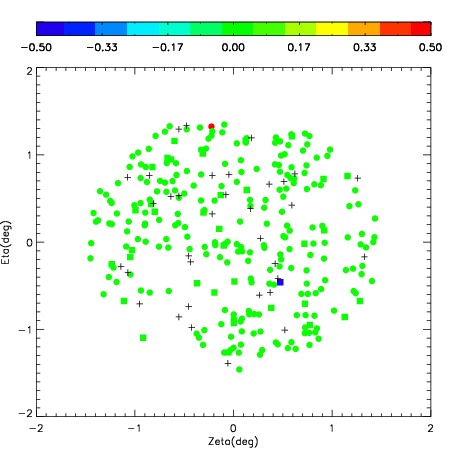
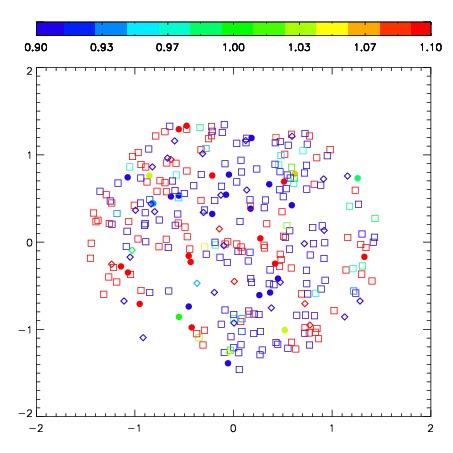
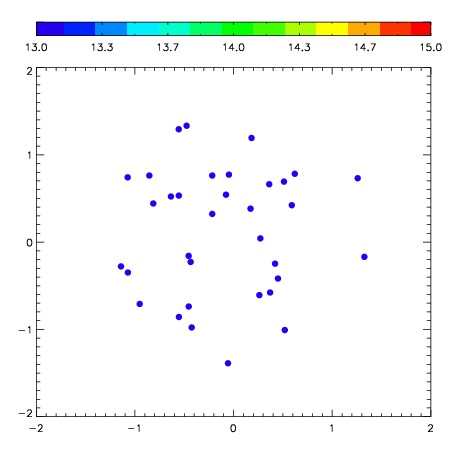
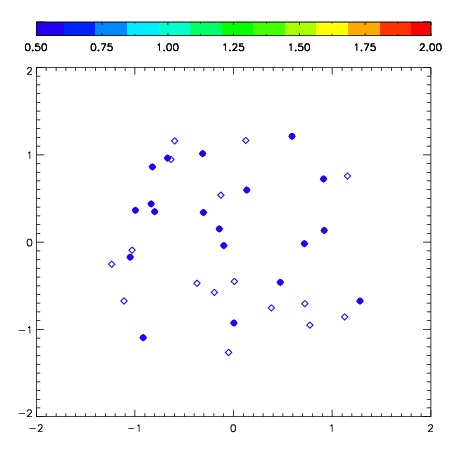
| Frame | Nreads | Zeropoints | Mag plots | Spatial mag deviation | Spatial sky 16325A emission deviations (filled: sky, open: star) | Spatial sky continuum emission | Spatial sky telluric CO2 absorption deviations (filled: H < 10) | |||||||||||||||||||||||
| 0 | 0 |
|
|
|
|
|
|
| IPAIR | NAME | SHIFT | NEWSHIFT | S/N | NAME | SHIFT | NEWSHIFT | S/N |
| 0 | 04300030 | 0.317858 | 0.00000 | 192.478 | 04300028 | -0.0845163 | 0.402374 | 235.566 |
| 1 | 04300027 | 0.300107 | 0.0177510 | 292.567 | 04300025 | 0.00000 | 0.317858 | 286.843 |
| 2 | 04300026 | 0.295499 | 0.0223590 | 289.394 | 04300032 | -0.0746453 | 0.392503 | 277.786 |
| 3 | 04300031 | 0.306904 | 0.0109540 | 262.302 | 04300029 | -0.0856681 | 0.403526 | 254.070 |