| Red | Green | Blue | |
| z | 17.64 | ||
| znorm | Inf | ||
| sky | -Inf | -Inf | -Inf |
| S/N | 22.8 | 38.9 | 50.8 |
| S/N(c) | 0.0 | 0.0 | 0.0 |
| SN(E/C) |

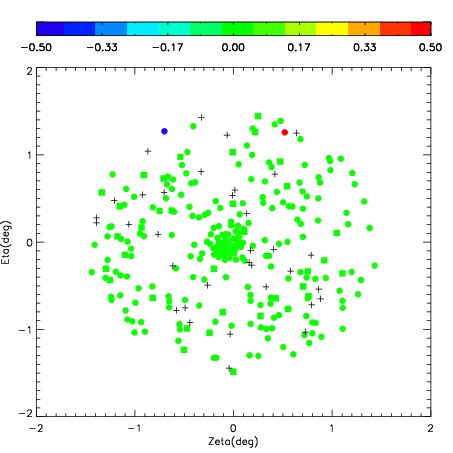


| Frame | Nreads | Zeropoints | Mag plots | Spatial mag deviation | Spatial sky 16325A emission deviations (filled: sky, open: star) | Spatial sky continuum emission | Spatial sky telluric CO2 absorption deviations (filled: H < 10) | |||||||||||||||||||||||
| 0 | 0 |
|
|
|
|
|
|
| IPAIR | NAME | SHIFT | NEWSHIFT | S/N | NAME | SHIFT | NEWSHIFT | S/N |
| 0 | 04360049 | 0.467820 | 0.00000 | 276.832 | 04360047 | 0.00000 | 0.467820 | 279.223 |
| 1 | 04360048 | 0.465286 | 0.00253400 | 282.845 | 04360050 | 0.0194636 | 0.448356 | 282.223 |
| 2 | 04360053 | 0.465672 | 0.00214800 | 260.926 | 04360051 | 0.0164051 | 0.451415 | 268.206 |
| 3 | 04360052 | 0.463601 | 0.00421900 | 248.861 | 04360054 | 0.0212764 | 0.446544 | 204.268 |