| Red | Green | Blue | |
| z | 17.64 | ||
| znorm | Inf | ||
| sky | -Inf | -Inf | -Inf |
| S/N | 21.6 | 34.8 | 39.4 |
| S/N(c) | 0.0 | 0.0 | 0.0 |
| SN(E/C) |

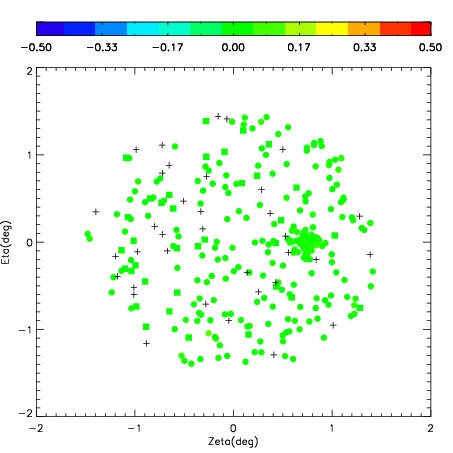
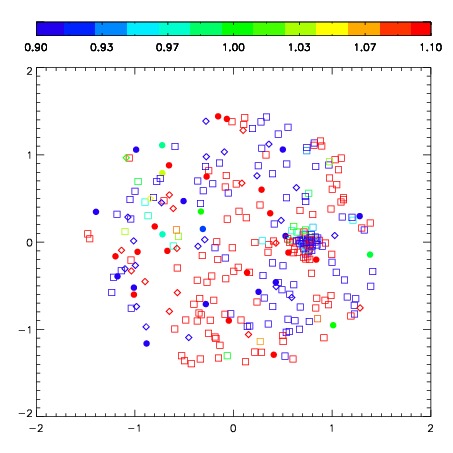
| Frame | Nreads | Zeropoints | Mag plots | Spatial mag deviation | Spatial sky 16325A emission deviations (filled: sky, open: star) | Spatial sky continuum emission | Spatial sky telluric CO2 absorption deviations (filled: H < 10) | |||||||||||||||||||||||
| 0 | 0 |
|
|
|
|
|
|
| IPAIR | NAME | SHIFT | NEWSHIFT | S/N | NAME | SHIFT | NEWSHIFT | S/N |
| 0 | 05490024 | 0.482351 | 0.00000 | 256.607 | 05490026 | 0.0308523 | 0.451499 | 253.510 |
| 1 | 05490028 | 0.463507 | 0.0188440 | 257.517 | 05490022 | 0.00000 | 0.482351 | 263.438 |
| 2 | 05490023 | 0.475511 | 0.00683999 | 256.022 | 05490025 | 0.0343658 | 0.447985 | 249.168 |
| 3 | 05490027 | 0.473328 | 0.00902301 | 246.123 | 05490029 | 0.0395766 | 0.442774 | 229.372 |