| Red | Green | Blue | |
| z | 17.66 | ||
| znorm | Inf | ||
| sky | -Inf | -Inf | -Inf |
| S/N | 12.4 | 23.9 | 25.5 |
| S/N(c) | 0.0 | 0.0 | 0.0 |
| SN(E/C) |

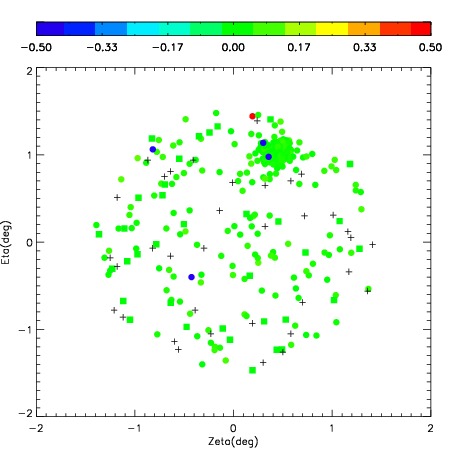
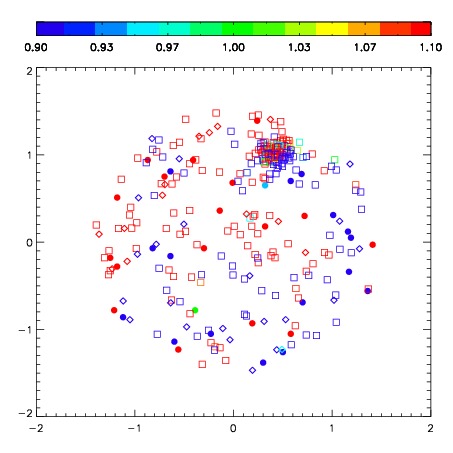


| Frame | Nreads | Zeropoints | Mag plots | Spatial mag deviation | Spatial sky 16325A emission deviations (filled: sky, open: star) | Spatial sky continuum emission | Spatial sky telluric CO2 absorption deviations (filled: H < 10) | |||||||||||||||||||||||
| 0 | 0 |
|
|
|
|
|
|
| IPAIR | NAME | SHIFT | NEWSHIFT | S/N | NAME | SHIFT | NEWSHIFT | S/N |
| 0 | 04040100 | 0.468155 | 0.00000 | 74.4305 | 04040098 | -0.0140553 | 0.482210 | 82.0164 |
| 1 | 04040105 | 0.443992 | 0.0241630 | 195.778 | 04040106 | -0.0261362 | 0.494291 | 226.571 |
| 2 | 04040104 | 0.453671 | 0.0144840 | 143.442 | 04040099 | -0.0122563 | 0.480411 | 104.680 |
| 3 | 04040097 | 0.449046 | 0.0191090 | 122.679 | 04040103 | 0.00875747 | 0.459398 | 102.574 |
| 4 | 04040101 | 0.446926 | 0.0212290 | 105.935 | 04040102 | -0.0192661 | 0.487421 | 93.0959 |
| 5 | 04040096 | 0.447336 | 0.0208190 | 47.4861 | 04040095 | 0.00000 | 0.468155 | 68.0278 |