| Red | Green | Blue | |
| z | 17.64 | ||
| znorm | Inf | ||
| sky | -Inf | -Inf | -Inf |
| S/N | 20.4 | 36.3 | 39.3 |
| S/N(c) | 0.0 | 0.0 | 0.0 |
| SN(E/C) |


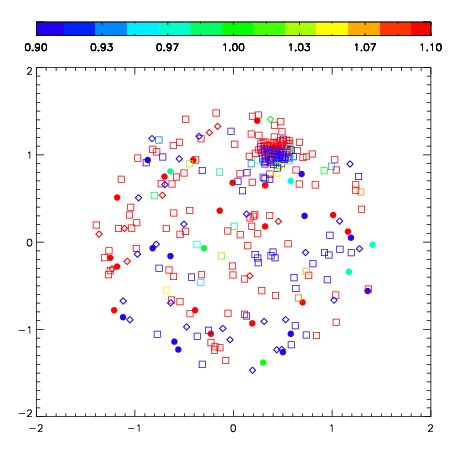


| Frame | Nreads | Zeropoints | Mag plots | Spatial mag deviation | Spatial sky 16325A emission deviations (filled: sky, open: star) | Spatial sky continuum emission | Spatial sky telluric CO2 absorption deviations (filled: H < 10) | |||||||||||||||||||||||
| 0 | 0 |
|
|
|
|
|
|
| IPAIR | NAME | SHIFT | NEWSHIFT | S/N | NAME | SHIFT | NEWSHIFT | S/N |
| 0 | 04620029 | 0.485312 | 0.00000 | 193.967 | 04620034 | -0.00177163 | 0.487084 | 219.408 |
| 1 | 04620032 | 0.466985 | 0.0183270 | 227.701 | 04620031 | -0.0143035 | 0.499616 | 244.970 |
| 2 | 04620033 | 0.468944 | 0.0163680 | 222.757 | 04620030 | -0.0299253 | 0.515237 | 234.027 |
| 3 | 04620028 | 0.451156 | 0.0341560 | 102.561 | 04620027 | 0.00000 | 0.485312 | 205.780 |