| Red | Green | Blue | |
| z | 17.64 | ||
| znorm | Inf | ||
| sky | -NaN | -Inf | -Inf |
| S/N | 26.9 | 45.9 | 50.2 |
| S/N(c) | 0.0 | 0.0 | 0.0 |
| SN(E/C) |
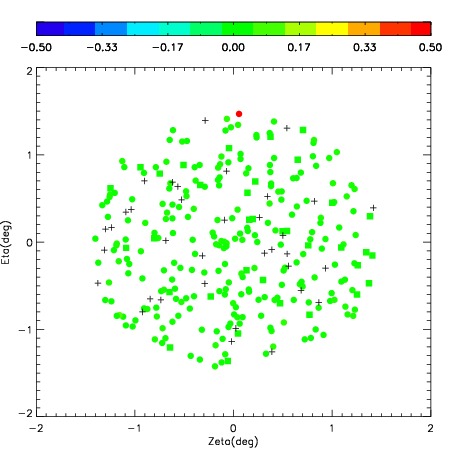
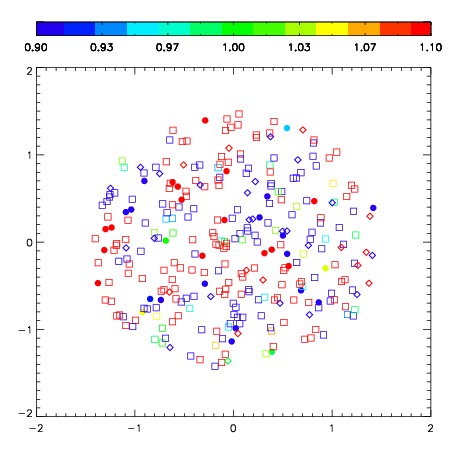


| Frame | Nreads | Zeropoints | Mag plots | Spatial mag deviation | Spatial sky 16325A emission deviations (filled: sky, open: star) | Spatial sky continuum emission | Spatial sky telluric CO2 absorption deviations (filled: H < 10) | |||||||||||||||||||||||
| 0 | 0 |
|
|
|
|
|
|
| IPAIR | NAME | SHIFT | NEWSHIFT | S/N | NAME | SHIFT | NEWSHIFT | S/N |
| 0 | 04670041 | 0.390451 | 0.00000 | 240.052 | 04670036 | 0.00000 | 0.390451 | 240.503 |
| 1 | 04670038 | 0.378519 | 0.0119320 | 261.476 | 04670039 | -0.0137354 | 0.404186 | 255.332 |
| 2 | 04670042 | 0.377310 | 0.0131410 | 256.696 | 04670043 | -0.0175440 | 0.407995 | 248.320 |
| 3 | 04670037 | 0.387536 | 0.00291502 | 256.472 | 04670040 | -0.0187097 | 0.409161 | 248.233 |