| Red | Green | Blue | |
| z | 17.64 | ||
| znorm | Inf | ||
| sky | -Inf | -Inf | -Inf |
| S/N | 36.6 | 61.0 | 66.5 |
| S/N(c) | 0.0 | 0.0 | 0.0 |
| SN(E/C) |

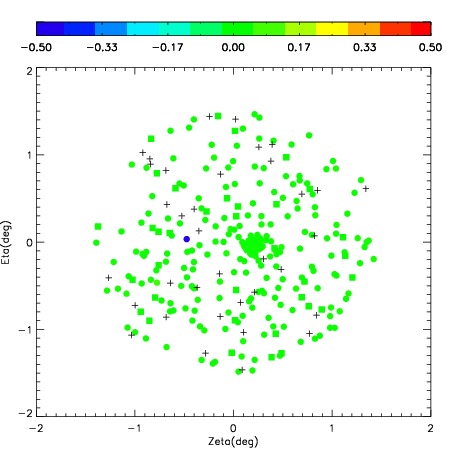


| Frame | Nreads | Zeropoints | Mag plots | Spatial mag deviation | Spatial sky 16325A emission deviations (filled: sky, open: star) | Spatial sky continuum emission | Spatial sky telluric CO2 absorption deviations (filled: H < 10) | |||||||||||||||||||||||
| 0 | 0 |
|
|
|
|
|
|
| IPAIR | NAME | SHIFT | NEWSHIFT | S/N | NAME | SHIFT | NEWSHIFT | S/N |
| 0 | 04370052 | 0.425812 | 0.00000 | 281.066 | 04370050 | 0.0150244 | 0.410788 | 281.012 |
| 1 | 04370056 | 0.424575 | 0.00123700 | 287.039 | 04370054 | 0.0131302 | 0.412682 | 287.700 |
| 2 | 04370053 | 0.410335 | 0.0154770 | 286.100 | 04370051 | 0.0106500 | 0.415162 | 286.456 |
| 3 | 04370048 | 0.418375 | 0.00743702 | 284.079 | 04370055 | 0.00823981 | 0.417572 | 286.259 |
| 4 | 04370049 | 0.411742 | 0.0140700 | 283.271 | 04370047 | 0.00000 | 0.425812 | 285.142 |