| Red | Green | Blue | |
| z | 17.64 | ||
| znorm | Inf | ||
| sky | -Inf | -Inf | -Inf |
| S/N | 29.8 | 50.9 | 54.6 |
| S/N(c) | 0.0 | 0.0 | 0.0 |
| SN(E/C) |


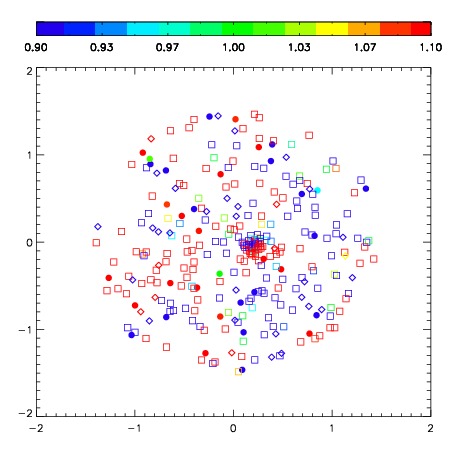
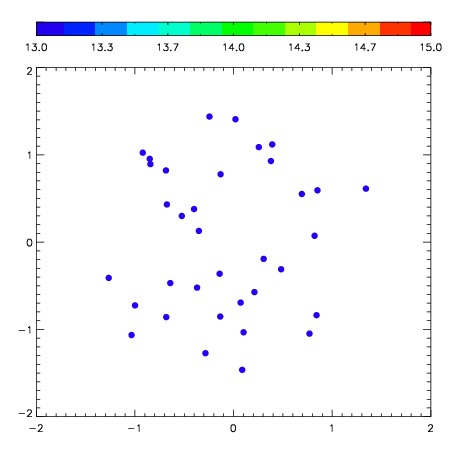
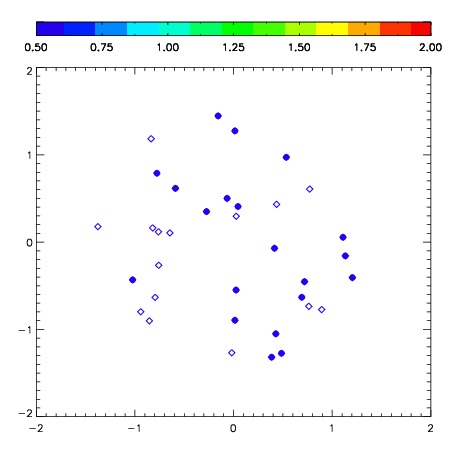
| Frame | Nreads | Zeropoints | Mag plots | Spatial mag deviation | Spatial sky 16325A emission deviations (filled: sky, open: star) | Spatial sky continuum emission | Spatial sky telluric CO2 absorption deviations (filled: H < 10) | |||||||||||||||||||||||
| 0 | 0 |
|
|
|
|
|
|
| IPAIR | NAME | SHIFT | NEWSHIFT | S/N | NAME | SHIFT | NEWSHIFT | S/N |
| 0 | 04600075 | 0.350673 | 0.00000 | 258.733 | 04600073 | -0.0520370 | 0.402710 | 254.357 |
| 1 | 04600071 | 0.341760 | 0.00891298 | 259.808 | 04600076 | -0.0453310 | 0.396004 | 264.801 |
| 2 | 04600074 | 0.339733 | 0.0109400 | 259.050 | 04600069 | 0.00000 | 0.350673 | 258.494 |
| 3 | 04600070 | 0.345550 | 0.00512299 | 257.059 | 04600072 | -0.0451114 | 0.395784 | 248.651 |