| Red | Green | Blue | |
| z | 17.64 | ||
| znorm | Inf | ||
| sky | -Inf | -Inf | -Inf |
| S/N | 29.0 | 49.6 | 52.6 |
| S/N(c) | 0.0 | 0.0 | 0.0 |
| SN(E/C) |

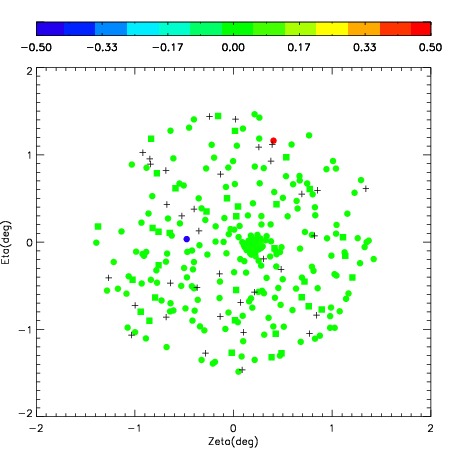
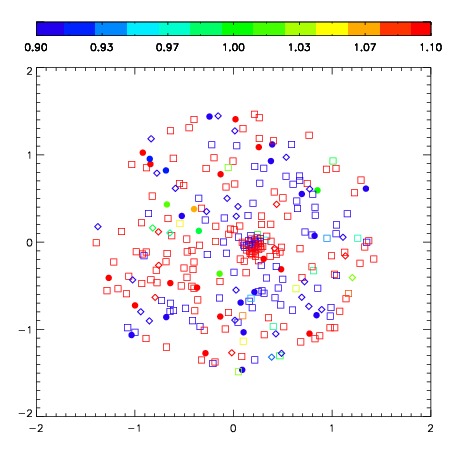
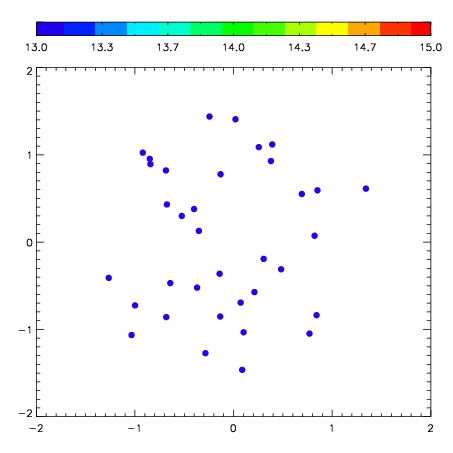
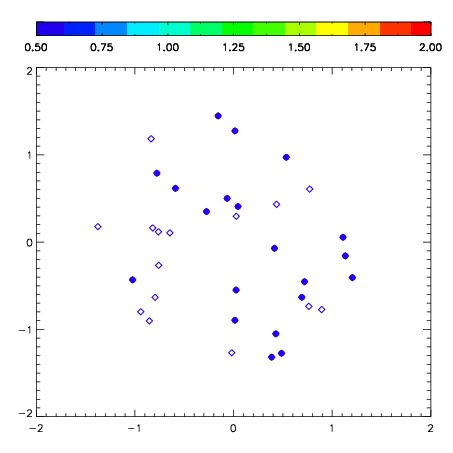
| Frame | Nreads | Zeropoints | Mag plots | Spatial mag deviation | Spatial sky 16325A emission deviations (filled: sky, open: star) | Spatial sky continuum emission | Spatial sky telluric CO2 absorption deviations (filled: H < 10) | |||||||||||||||||||||||
| 0 | 0 |
|
|
|
|
|
|
| IPAIR | NAME | SHIFT | NEWSHIFT | S/N | NAME | SHIFT | NEWSHIFT | S/N |
| 0 | 04610012 | 0.352220 | 0.00000 | 255.349 | 04610013 | -0.0352477 | 0.387468 | 254.411 |
| 1 | 04610016 | 0.333748 | 0.0184720 | 261.645 | 04610017 | -0.0394183 | 0.391638 | 263.465 |
| 2 | 04610015 | 0.339016 | 0.0132040 | 260.948 | 04610014 | -0.0428328 | 0.395053 | 259.245 |
| 3 | 04610011 | 0.340158 | 0.0120620 | 254.447 | 04610010 | 0.00000 | 0.352220 | 254.049 |