| Red | Green | Blue | |
| z | 17.64 | ||
| znorm | Inf | ||
| sky | -NaN | -Inf | -Inf |
| S/N | 24.6 | 43.2 | 45.8 |
| S/N(c) | 0.0 | 0.0 | 0.0 |
| SN(E/C) |

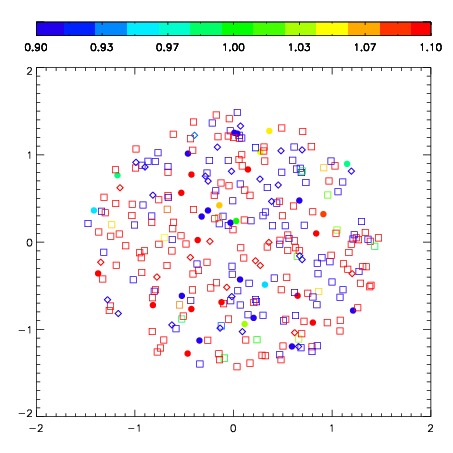
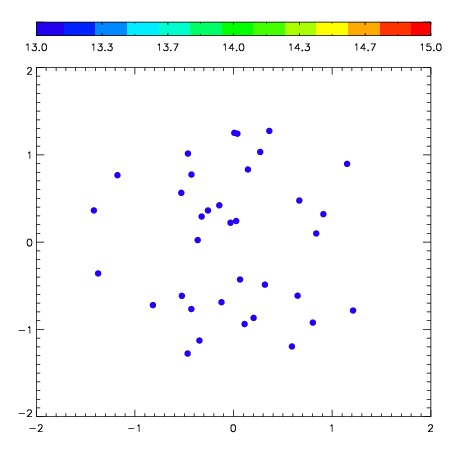

| Frame | Nreads | Zeropoints | Mag plots | Spatial mag deviation | Spatial sky 16325A emission deviations (filled: sky, open: star) | Spatial sky continuum emission | Spatial sky telluric CO2 absorption deviations (filled: H < 10) | |||||||||||||||||||||||
| 0 | 0 |
|
|
|
|
|
|
| IPAIR | NAME | SHIFT | NEWSHIFT | S/N | NAME | SHIFT | NEWSHIFT | S/N |
| 0 | 08970017 | 0.508514 | 0.00000 | 297.966 | 08970018 | 0.0859545 | 0.422559 | 287.497 |
| 1 | 08970016 | 0.480464 | 0.0280500 | 305.933 | 08970015 | 0.0829480 | 0.425566 | 311.888 |
| 2 | 08970012 | 0.484095 | 0.0244190 | 302.725 | 08970014 | 0.0762120 | 0.432302 | 306.696 |
| 3 | 08970013 | 0.475573 | 0.0329410 | 301.778 | 08970011 | 0.00000 | 0.508514 | 293.400 |