| Frame | Nreads | Zeropoints | Mag plots
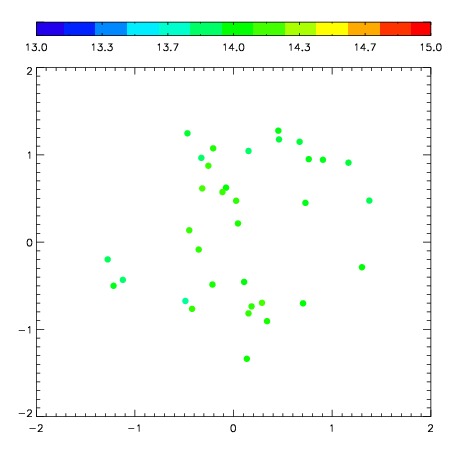
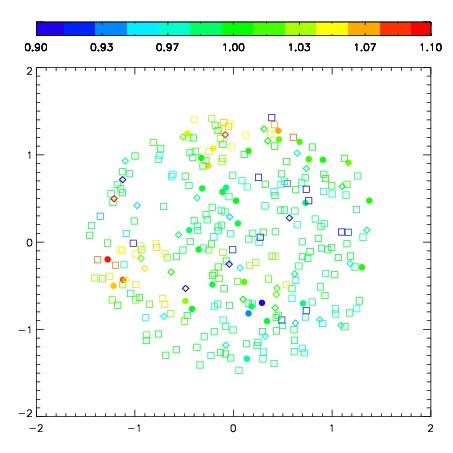
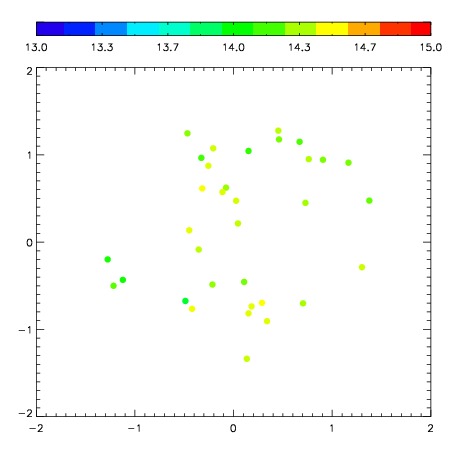
| Spatial mag deviation
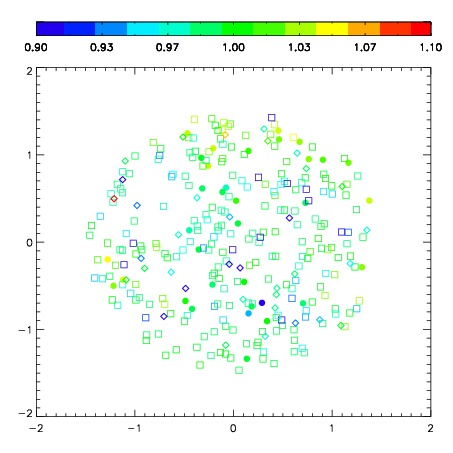
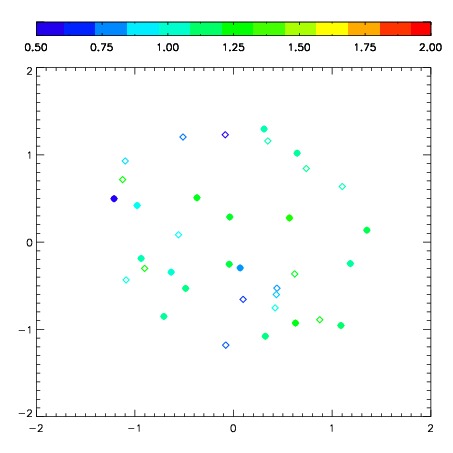
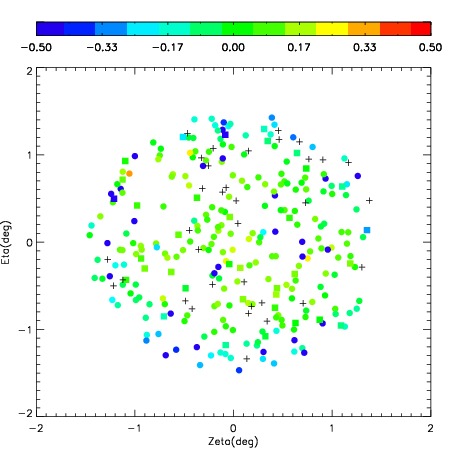
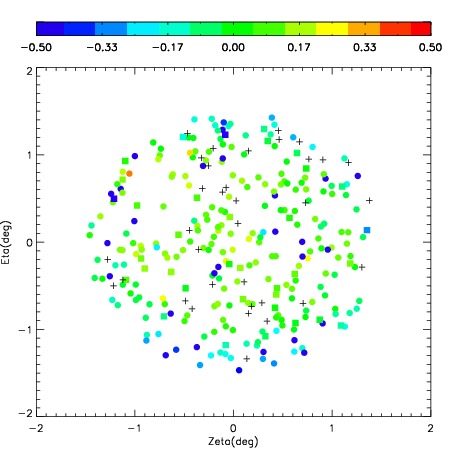
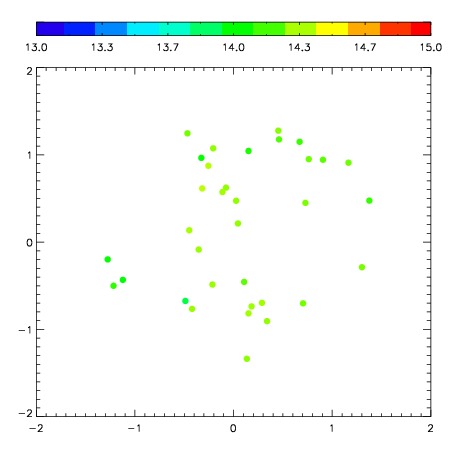
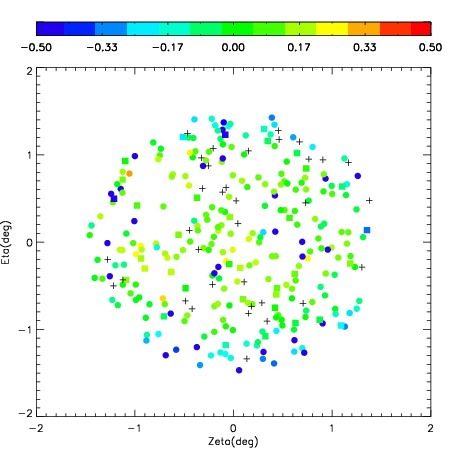
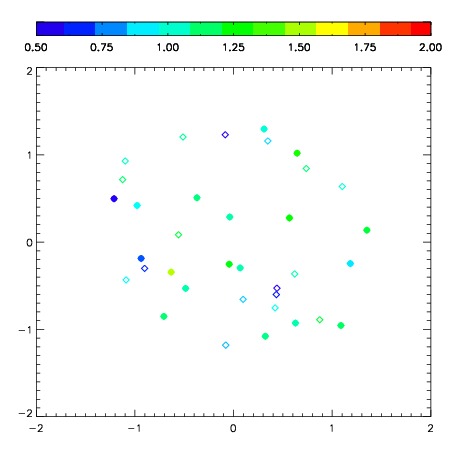
| Spatial sky 16325A emission deviations (filled: sky, open: star)
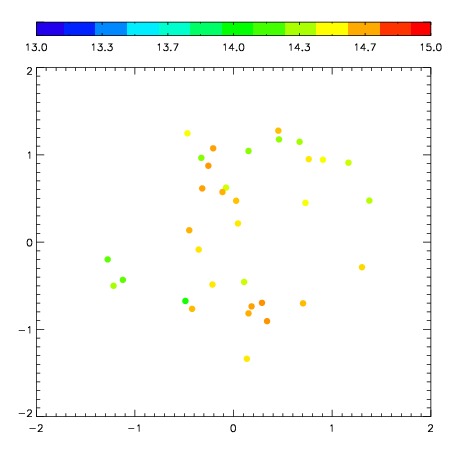
| Spatial sky continuum emission
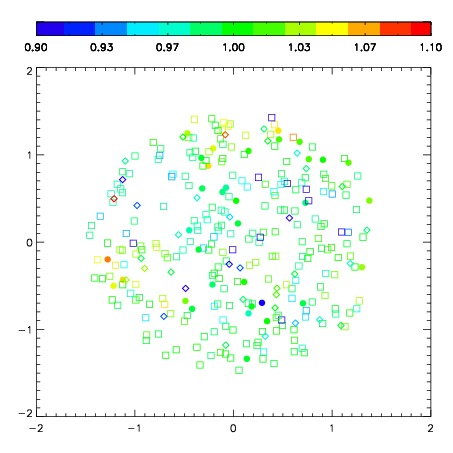
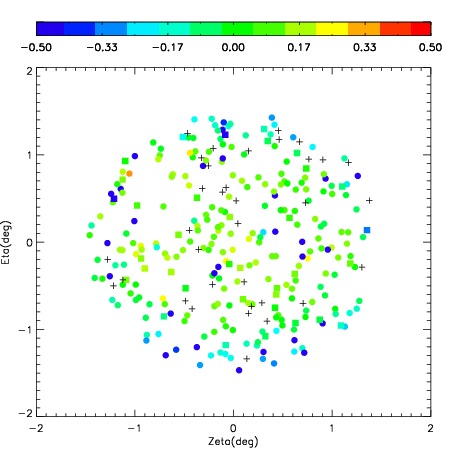
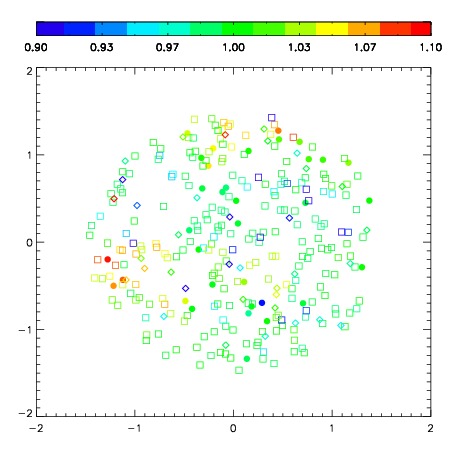
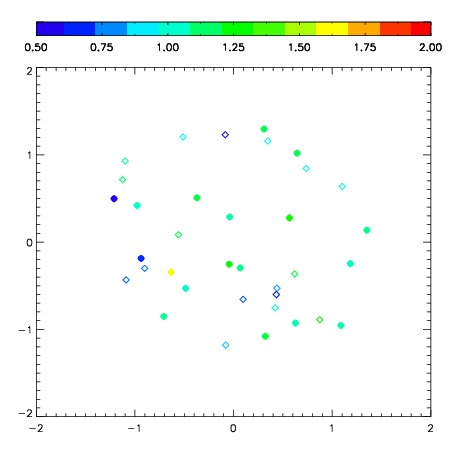
| Spatial sky telluric CO2 absorption deviations (filled: H < 10)
|
| 4890014
| 47
| | Red | Green | Blue
| | z | | 18.95
| | znorm | | 14.77
| | sky | 14.1 | 14.0 | 13.9
| | S/N | 15.2 | 25.0 | 25.8
| | S/N(c) | 13.8 | 23.1 | 24.5
| | SN(E/C) 0.36
|
| 
| 
| 
| 
| 
|
| 4890015
| 47
| | Red | Green | Blue
| | z | | 19.00
| | znorm | | 14.82
| | sky | 14.4 | 14.2 | 14.5
| | S/N | 15.1 | 25.8 | 27.0
| | S/N(c) | 13.8 | 24.0 | 25.7
| | SN(E/C) 0.37
|
| 
| 
| 
| 
| 
|
| 4890016
| 47
| | Red | Green | Blue
| | z | | 18.85
| | znorm | | 14.67
| | sky | 14.3 | 14.3 | 14.5
| | S/N | 13.6 | 23.6 | 24.9
| | S/N(c) | 12.3 | 21.8 | 23.1
| | SN(E/C) 0.41
|
| 
| 
| 
| 
| 
|
| 4890017
| 47
| | Red | Green | Blue
| | z | | 18.82
| | znorm | | 14.64
| | sky | 14.3 | 14.2 | 14.4
| | S/N | 13.4 | 23.0 | 24.2
| | S/N(c) | 12.1 | 21.1 | 22.3
| | SN(E/C) 0.44
|
| 
| 
| 
| 
| 
|
| 4890018
| 47
| | Red | Green | Blue
| | z | | 18.89
| | znorm | | 14.71
| | sky | 14.5 | 14.3 | 14.4
| | S/N | 14.2 | 23.8 | 25.0
| | S/N(c) | 12.6 | 22.0 | 23.5
| | SN(E/C) 0.40
|
| 
| 
| 
| 
| 
|
| 4890019
| 47
| | Red | Green | Blue
| | z | | 18.90
| | znorm | | 14.72
| | sky | 14.5 | 14.3 | 14.4
| | S/N | 14.0 | 23.7 | 25.1
| | S/N(c) | 12.6 | 22.0 | 23.7
| | SN(E/C) 0.42
|
| 
| 
| 
| 
| 
|
| 4890020
| 47
| | Red | Green | Blue
| | z | | 18.93
| | znorm | | 14.75
| | sky | 14.6 | 14.5 | 14.6
| | S/N | 14.1 | 23.9 | 25.1
| | S/N(c) | 12.7 | 22.1 | 23.5
| | SN(E/C) 0.44
|
| 
| 
| 
| 
| 
|
| 4890021
| 47
| | Red | Green | Blue
| | z | | 19.00
| | znorm | | 14.82
| | sky | 14.8 | 14.5 | 14.6
| | S/N | 14.9 | 24.9 | 26.4
| | S/N(c) | 13.4 | 23.4 | 24.8
| | SN(E/C) 0.40
|
| 
| 
| 
| 
| 
|