| Red | Green | Blue | |
| z | 17.64 | ||
| znorm | Inf | ||
| sky | -NaN | -Inf | -Inf |
| S/N | 25.2 | 44.4 | 47.3 |
| S/N(c) | 0.0 | 0.0 | 0.0 |
| SN(E/C) |
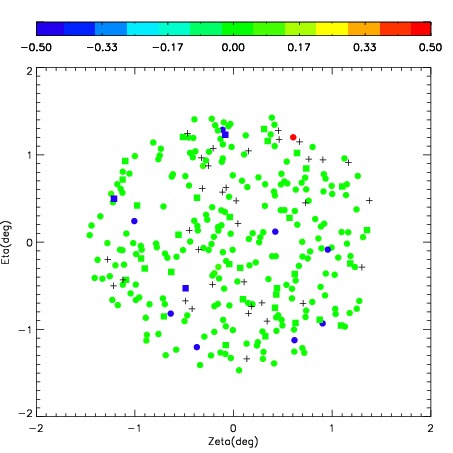


| Frame | Nreads | Zeropoints | Mag plots | Spatial mag deviation | Spatial sky 16325A emission deviations (filled: sky, open: star) | Spatial sky continuum emission | Spatial sky telluric CO2 absorption deviations (filled: H < 10) | |||||||||||||||||||||||
| 0 | 0 |
|
|
|
|
|
|
| IPAIR | NAME | SHIFT | NEWSHIFT | S/N | NAME | SHIFT | NEWSHIFT | S/N |
| 0 | 04890016 | 0.461124 | 0.00000 | 210.243 | 04890017 | 0.0187447 | 0.442379 | 209.383 |
| 1 | 04890015 | 0.453508 | 0.00761601 | 226.650 | 04890021 | 0.0216925 | 0.439431 | 226.890 |
| 2 | 04890020 | 0.457895 | 0.00322899 | 220.538 | 04890014 | 0.00000 | 0.461124 | 220.646 |
| 3 | 04890019 | 0.453893 | 0.00723100 | 217.399 | 04890018 | 0.0229414 | 0.438183 | 216.404 |