| Red | Green | Blue | |
| z | 17.63 | ||
| znorm | Inf | ||
| sky | -NaN | -NaN | -Inf |
| S/N | 27.0 | 45.9 | 49.5 |
| S/N(c) | 0.0 | 0.0 | 0.0 |
| SN(E/C) |
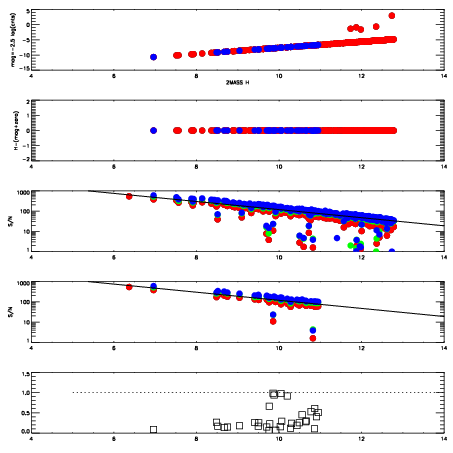


| Frame | Nreads | Zeropoints | Mag plots | Spatial mag deviation | Spatial sky 16325A emission deviations (filled: sky, open: star) | Spatial sky continuum emission | Spatial sky telluric CO2 absorption deviations (filled: H < 10) | |||||||||||||||||||||||
| 0 | 0 |
|
|
|
|
|
|
| IPAIR | NAME | SHIFT | NEWSHIFT | S/N | NAME | SHIFT | NEWSHIFT | S/N |
| 0 | 08430016 | 0.611673 | 0.00000 | 228.720 | 08430014 | 0.0987867 | 0.512886 | 229.928 |
| 1 | 08430017 | 0.599754 | 0.0119190 | 236.590 | 08430018 | 0.103777 | 0.507896 | 238.976 |
| 2 | 08430012 | 0.601546 | 0.0101270 | 227.981 | 08430015 | 0.100476 | 0.511197 | 226.844 |
| 3 | 08430013 | 0.603968 | 0.00770497 | 227.362 | 08430011 | 0.00000 | 0.611673 | 223.312 |